Immigrants from Nicaragua vs Immigrants from Lithuania Unemployment
COMPARE
Immigrants from Nicaragua
Immigrants from Lithuania
Unemployment
Unemployment Comparison
Immigrants from Nicaragua
Immigrants from Lithuania
5.2%
UNEMPLOYMENT
57.1/ 100
METRIC RATING
170th/ 347
METRIC RANK
5.0%
UNEMPLOYMENT
93.2/ 100
METRIC RATING
110th/ 347
METRIC RANK
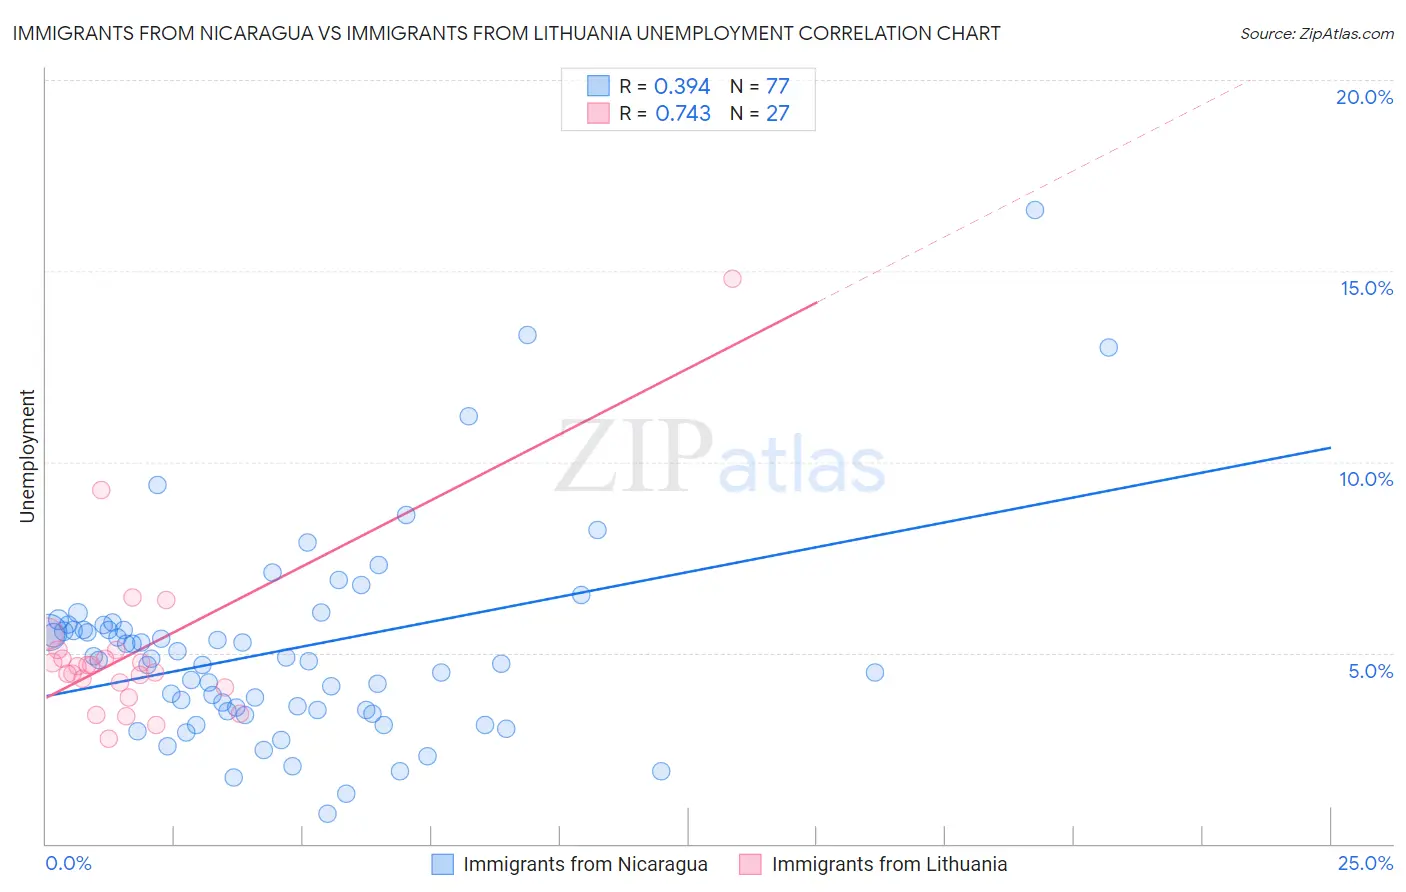
Immigrants from Nicaragua vs Immigrants from Lithuania Unemployment Correlation Chart
The statistical analysis conducted on geographies consisting of 236,258,373 people shows a mild positive correlation between the proportion of Immigrants from Nicaragua and unemployment in the United States with a correlation coefficient (R) of 0.394 and weighted average of 5.2%. Similarly, the statistical analysis conducted on geographies consisting of 117,711,175 people shows a strong positive correlation between the proportion of Immigrants from Lithuania and unemployment in the United States with a correlation coefficient (R) of 0.743 and weighted average of 5.0%, a difference of 3.7%.
Unemployment Correlation Summary
| Measurement | Immigrants from Nicaragua | Immigrants from Lithuania |
| Minimum | 0.80% | 2.7% |
| Maximum | 16.6% | 14.8% |
| Range | 15.8% | 12.1% |
| Mean | 5.1% | 5.0% |
| Median | 4.8% | 4.7% |
| Interquartile 25% (IQ1) | 3.5% | 4.1% |
| Interquartile 75% (IQ3) | 5.7% | 5.1% |
| Interquartile Range (IQR) | 2.2% | 0.96% |
| Standard Deviation (Sample) | 2.6% | 2.3% |
| Standard Deviation (Population) | 2.6% | 2.3% |
Similar Demographics by Unemployment
Demographics Similar to Immigrants from Nicaragua by Unemployment
In terms of unemployment, the demographic groups most similar to Immigrants from Nicaragua are Puget Sound Salish (5.2%, a difference of 0.040%), Immigrants from Morocco (5.2%, a difference of 0.12%), Uruguayan (5.2%, a difference of 0.19%), Colombian (5.2%, a difference of 0.25%), and Immigrants from Indonesia (5.2%, a difference of 0.26%).
| Demographics | Rating | Rank | Unemployment |
| Immigrants | Zaire | 64.7 /100 | #163 | Good 5.2% |
| Immigrants | Colombia | 64.7 /100 | #164 | Good 5.2% |
| Immigrants | Brazil | 63.1 /100 | #165 | Good 5.2% |
| Immigrants | Indonesia | 61.2 /100 | #166 | Good 5.2% |
| Colombians | 61.1 /100 | #167 | Good 5.2% |
| Uruguayans | 60.2 /100 | #168 | Good 5.2% |
| Immigrants | Morocco | 59.1 /100 | #169 | Average 5.2% |
| Immigrants | Nicaragua | 57.1 /100 | #170 | Average 5.2% |
| Puget Sound Salish | 56.6 /100 | #171 | Average 5.2% |
| Immigrants | Vietnam | 52.5 /100 | #172 | Average 5.2% |
| Immigrants | Poland | 51.8 /100 | #173 | Average 5.3% |
| Immigrants | Congo | 50.0 /100 | #174 | Average 5.3% |
| Taiwanese | 49.6 /100 | #175 | Average 5.3% |
| Nicaraguans | 48.7 /100 | #176 | Average 5.3% |
| Immigrants | Nonimmigrants | 47.9 /100 | #177 | Average 5.3% |
Demographics Similar to Immigrants from Lithuania by Unemployment
In terms of unemployment, the demographic groups most similar to Immigrants from Lithuania are Chilean (5.0%, a difference of 0.0%), Immigrants from Eritrea (5.0%, a difference of 0.020%), Immigrants from Kuwait (5.0%, a difference of 0.12%), Immigrants from Turkey (5.0%, a difference of 0.13%), and Immigrants from Romania (5.0%, a difference of 0.14%).
| Demographics | Rating | Rank | Unemployment |
| Chickasaw | 94.0 /100 | #103 | Exceptional 5.0% |
| Osage | 94.0 /100 | #104 | Exceptional 5.0% |
| Maltese | 94.0 /100 | #105 | Exceptional 5.0% |
| Immigrants | Romania | 93.7 /100 | #106 | Exceptional 5.0% |
| Immigrants | Turkey | 93.7 /100 | #107 | Exceptional 5.0% |
| Immigrants | Kuwait | 93.7 /100 | #108 | Exceptional 5.0% |
| Immigrants | Eritrea | 93.3 /100 | #109 | Exceptional 5.0% |
| Immigrants | Lithuania | 93.2 /100 | #110 | Exceptional 5.0% |
| Chileans | 93.2 /100 | #111 | Exceptional 5.0% |
| South Africans | 92.6 /100 | #112 | Exceptional 5.1% |
| Argentineans | 92.4 /100 | #113 | Exceptional 5.1% |
| Immigrants | Ireland | 92.1 /100 | #114 | Exceptional 5.1% |
| Immigrants | Western Europe | 91.1 /100 | #115 | Exceptional 5.1% |
| Immigrants | Sri Lanka | 91.1 /100 | #116 | Exceptional 5.1% |
| Immigrants | Malaysia | 91.0 /100 | #117 | Exceptional 5.1% |