Immigrants from Saudi Arabia vs Immigrants from Austria Female Unemployment
COMPARE
Immigrants from Saudi Arabia
Immigrants from Austria
Female Unemployment
Female Unemployment Comparison
Immigrants from Saudi Arabia
Immigrants from Austria
5.1%
FEMALE UNEMPLOYMENT
91.2/ 100
METRIC RATING
113th/ 347
METRIC RANK
5.0%
FEMALE UNEMPLOYMENT
95.7/ 100
METRIC RATING
93rd/ 347
METRIC RANK
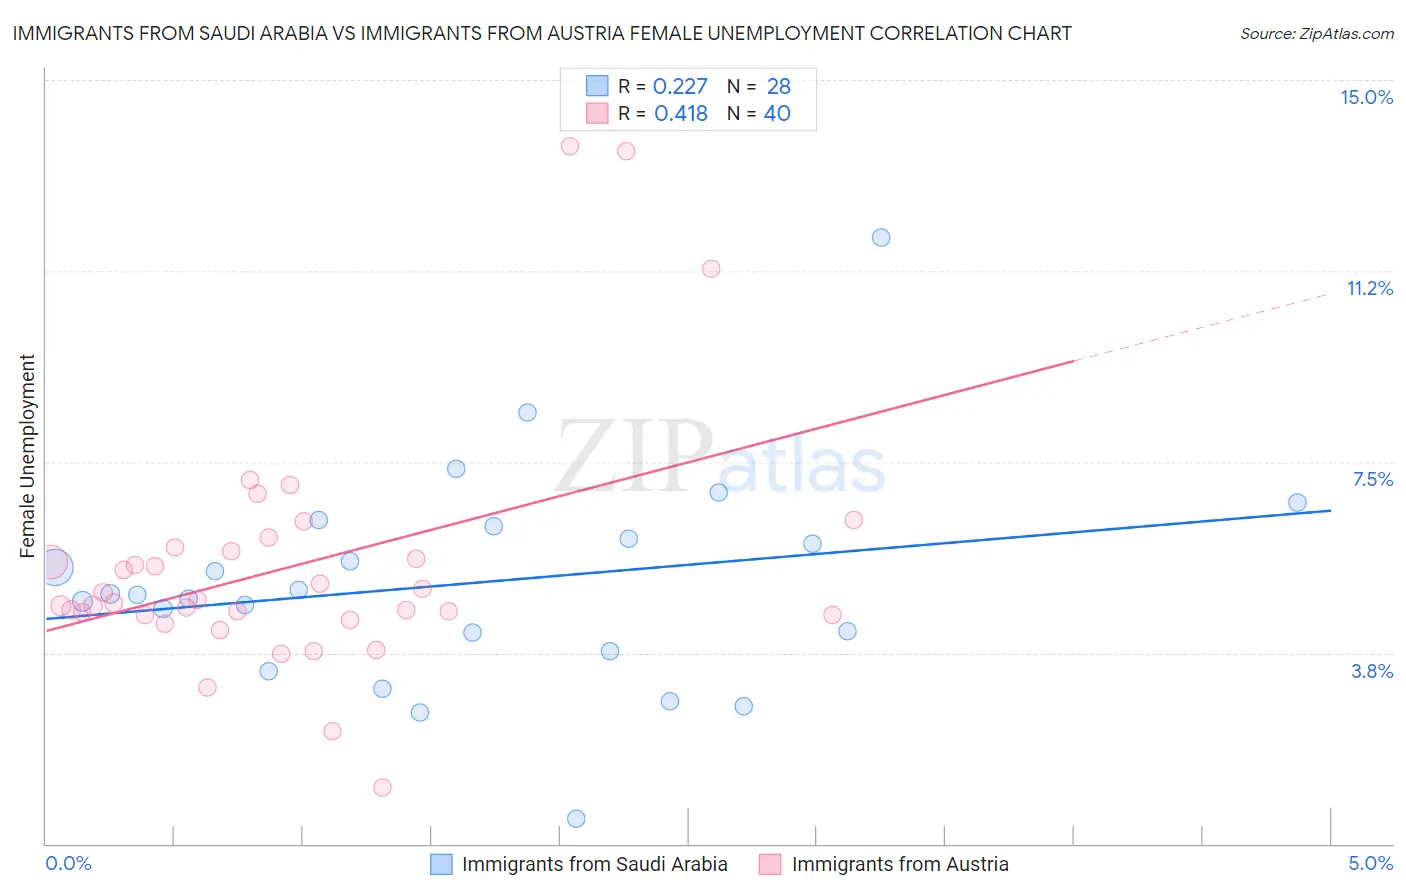
Immigrants from Saudi Arabia vs Immigrants from Austria Female Unemployment Correlation Chart
The statistical analysis conducted on geographies consisting of 164,209,507 people shows a weak positive correlation between the proportion of Immigrants from Saudi Arabia and unemploymnet rate among females in the United States with a correlation coefficient (R) of 0.227 and weighted average of 5.1%. Similarly, the statistical analysis conducted on geographies consisting of 167,645,945 people shows a moderate positive correlation between the proportion of Immigrants from Austria and unemploymnet rate among females in the United States with a correlation coefficient (R) of 0.418 and weighted average of 5.0%, a difference of 1.2%.
Female Unemployment Correlation Summary
| Measurement | Immigrants from Saudi Arabia | Immigrants from Austria |
| Minimum | 0.50% | 1.1% |
| Maximum | 11.9% | 13.7% |
| Range | 11.4% | 12.6% |
| Mean | 5.1% | 5.5% |
| Median | 4.9% | 4.8% |
| Interquartile 25% (IQ1) | 4.0% | 4.5% |
| Interquartile 75% (IQ3) | 6.1% | 5.8% |
| Interquartile Range (IQR) | 2.1% | 1.3% |
| Standard Deviation (Sample) | 2.1% | 2.5% |
| Standard Deviation (Population) | 2.1% | 2.4% |
Demographics Similar to Immigrants from Saudi Arabia and Immigrants from Austria by Female Unemployment
In terms of female unemployment, the demographic groups most similar to Immigrants from Saudi Arabia are Estonian (5.1%, a difference of 0.18%), Immigrants from Burma/Myanmar (5.1%, a difference of 0.21%), Macedonian (5.1%, a difference of 0.24%), Immigrants from Eastern Africa (5.1%, a difference of 0.34%), and Puget Sound Salish (5.1%, a difference of 0.38%). Similarly, the demographic groups most similar to Immigrants from Austria are Immigrants from Malaysia (5.0%, a difference of 0.020%), Burmese (5.0%, a difference of 0.040%), Immigrants from South Central Asia (5.0%, a difference of 0.090%), Immigrants from Somalia (5.0%, a difference of 0.20%), and Immigrants from Kuwait (5.0%, a difference of 0.20%).
| Demographics | Rating | Rank | Female Unemployment |
| Immigrants | Austria | 95.7 /100 | #93 | Exceptional 5.0% |
| Immigrants | Malaysia | 95.7 /100 | #94 | Exceptional 5.0% |
| Burmese | 95.6 /100 | #95 | Exceptional 5.0% |
| Immigrants | South Central Asia | 95.5 /100 | #96 | Exceptional 5.0% |
| Immigrants | Somalia | 95.2 /100 | #97 | Exceptional 5.0% |
| Immigrants | Kuwait | 95.2 /100 | #98 | Exceptional 5.0% |
| Immigrants | Zaire | 95.2 /100 | #99 | Exceptional 5.0% |
| Indonesians | 95.1 /100 | #100 | Exceptional 5.0% |
| Immigrants | Czechoslovakia | 95.0 /100 | #101 | Exceptional 5.0% |
| Immigrants | Kenya | 94.8 /100 | #102 | Exceptional 5.0% |
| Somalis | 94.6 /100 | #103 | Exceptional 5.0% |
| Kenyans | 93.7 /100 | #104 | Exceptional 5.0% |
| Immigrants | England | 93.6 /100 | #105 | Exceptional 5.0% |
| Paraguayans | 93.2 /100 | #106 | Exceptional 5.1% |
| Immigrants | Switzerland | 93.1 /100 | #107 | Exceptional 5.1% |
| Puget Sound Salish | 93.0 /100 | #108 | Exceptional 5.1% |
| Immigrants | Eastern Africa | 92.8 /100 | #109 | Exceptional 5.1% |
| Macedonians | 92.4 /100 | #110 | Exceptional 5.1% |
| Immigrants | Burma/Myanmar | 92.3 /100 | #111 | Exceptional 5.1% |
| Estonians | 92.1 /100 | #112 | Exceptional 5.1% |
| Immigrants | Saudi Arabia | 91.2 /100 | #113 | Exceptional 5.1% |