Sudanese vs Immigrants from Austria Female Unemployment
COMPARE
Sudanese
Immigrants from Austria
Female Unemployment
Female Unemployment Comparison
Sudanese
Immigrants from Austria
4.8%
FEMALE UNEMPLOYMENT
99.8/ 100
METRIC RATING
31st/ 347
METRIC RANK
5.0%
FEMALE UNEMPLOYMENT
95.7/ 100
METRIC RATING
93rd/ 347
METRIC RANK
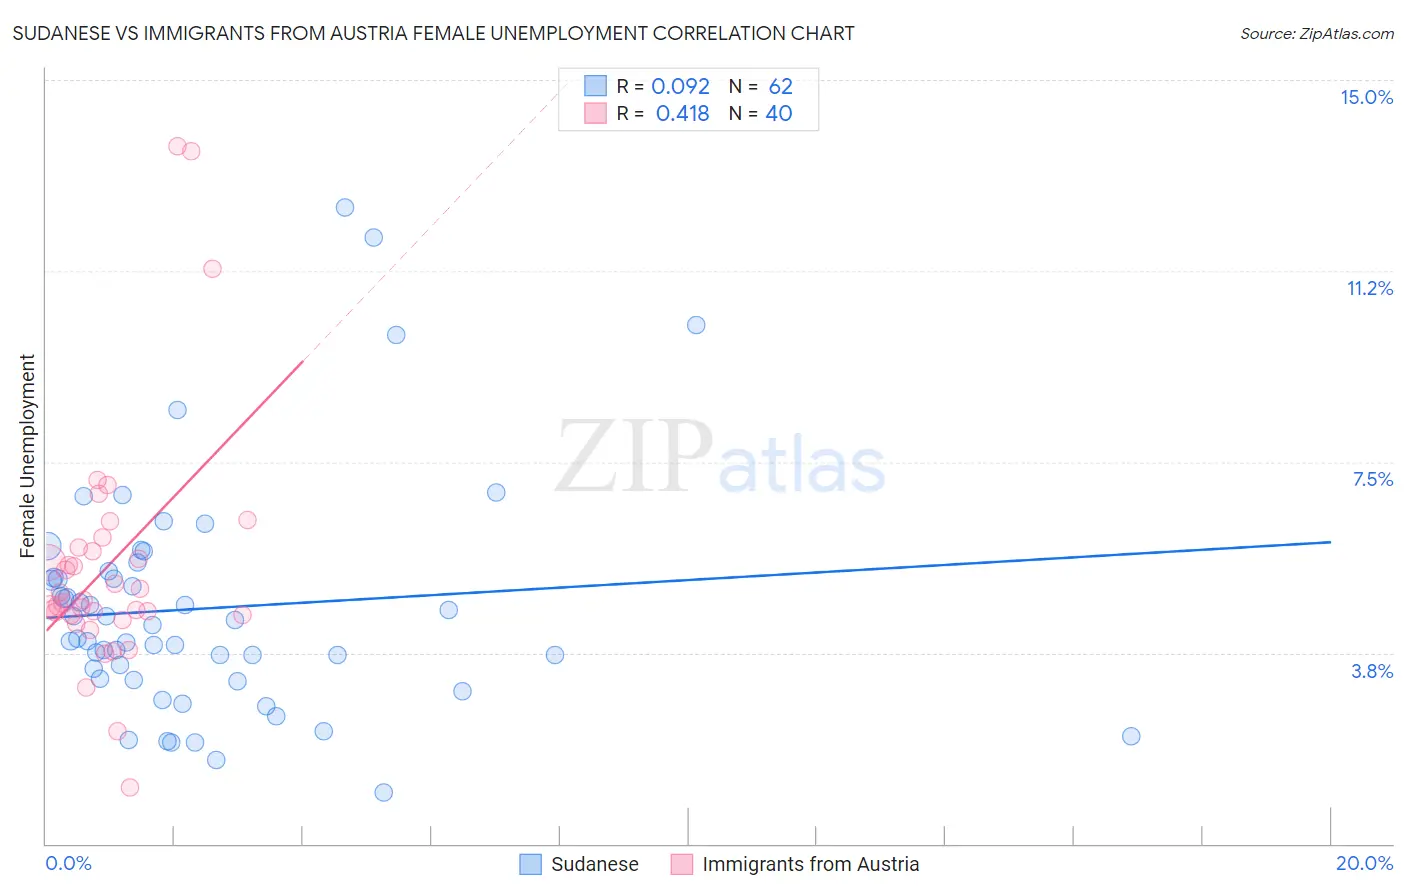
Sudanese vs Immigrants from Austria Female Unemployment Correlation Chart
The statistical analysis conducted on geographies consisting of 109,979,396 people shows a slight positive correlation between the proportion of Sudanese and unemploymnet rate among females in the United States with a correlation coefficient (R) of 0.092 and weighted average of 4.8%. Similarly, the statistical analysis conducted on geographies consisting of 167,645,945 people shows a moderate positive correlation between the proportion of Immigrants from Austria and unemploymnet rate among females in the United States with a correlation coefficient (R) of 0.418 and weighted average of 5.0%, a difference of 5.3%.
Female Unemployment Correlation Summary
| Measurement | Sudanese | Immigrants from Austria |
| Minimum | 1.0% | 1.1% |
| Maximum | 12.5% | 13.7% |
| Range | 11.5% | 12.6% |
| Mean | 4.6% | 5.5% |
| Median | 4.2% | 4.8% |
| Interquartile 25% (IQ1) | 3.2% | 4.5% |
| Interquartile 75% (IQ3) | 5.2% | 5.8% |
| Interquartile Range (IQR) | 2.0% | 1.3% |
| Standard Deviation (Sample) | 2.3% | 2.5% |
| Standard Deviation (Population) | 2.3% | 2.4% |
Similar Demographics by Female Unemployment
Demographics Similar to Sudanese by Female Unemployment
In terms of female unemployment, the demographic groups most similar to Sudanese are Slovak (4.8%, a difference of 0.14%), Lithuanian (4.7%, a difference of 0.28%), Cypriot (4.7%, a difference of 0.40%), Irish (4.7%, a difference of 0.41%), and British (4.7%, a difference of 0.44%).
| Demographics | Rating | Rank | Female Unemployment |
| Welsh | 99.9 /100 | #24 | Exceptional 4.7% |
| Immigrants | India | 99.9 /100 | #25 | Exceptional 4.7% |
| Immigrants | Bosnia and Herzegovina | 99.9 /100 | #26 | Exceptional 4.7% |
| British | 99.9 /100 | #27 | Exceptional 4.7% |
| Irish | 99.9 /100 | #28 | Exceptional 4.7% |
| Cypriots | 99.9 /100 | #29 | Exceptional 4.7% |
| Lithuanians | 99.8 /100 | #30 | Exceptional 4.7% |
| Sudanese | 99.8 /100 | #31 | Exceptional 4.8% |
| Slovaks | 99.8 /100 | #32 | Exceptional 4.8% |
| Czechoslovakians | 99.7 /100 | #33 | Exceptional 4.8% |
| Zimbabweans | 99.7 /100 | #34 | Exceptional 4.8% |
| French Canadians | 99.7 /100 | #35 | Exceptional 4.8% |
| Yugoslavians | 99.7 /100 | #36 | Exceptional 4.8% |
| Pennsylvania Germans | 99.6 /100 | #37 | Exceptional 4.8% |
| Northern Europeans | 99.6 /100 | #38 | Exceptional 4.8% |
Demographics Similar to Immigrants from Austria by Female Unemployment
In terms of female unemployment, the demographic groups most similar to Immigrants from Austria are Immigrants from Malaysia (5.0%, a difference of 0.020%), Burmese (5.0%, a difference of 0.040%), Romanian (5.0%, a difference of 0.080%), Immigrants from South Central Asia (5.0%, a difference of 0.090%), and Immigrants from Japan (5.0%, a difference of 0.10%).
| Demographics | Rating | Rank | Female Unemployment |
| Bolivians | 97.1 /100 | #86 | Exceptional 5.0% |
| Venezuelans | 96.9 /100 | #87 | Exceptional 5.0% |
| Immigrants | Sudan | 96.7 /100 | #88 | Exceptional 5.0% |
| Immigrants | Taiwan | 96.6 /100 | #89 | Exceptional 5.0% |
| Immigrants | Sweden | 96.3 /100 | #90 | Exceptional 5.0% |
| Immigrants | Japan | 96.0 /100 | #91 | Exceptional 5.0% |
| Romanians | 95.9 /100 | #92 | Exceptional 5.0% |
| Immigrants | Austria | 95.7 /100 | #93 | Exceptional 5.0% |
| Immigrants | Malaysia | 95.7 /100 | #94 | Exceptional 5.0% |
| Burmese | 95.6 /100 | #95 | Exceptional 5.0% |
| Immigrants | South Central Asia | 95.5 /100 | #96 | Exceptional 5.0% |
| Immigrants | Somalia | 95.2 /100 | #97 | Exceptional 5.0% |
| Immigrants | Kuwait | 95.2 /100 | #98 | Exceptional 5.0% |
| Immigrants | Zaire | 95.2 /100 | #99 | Exceptional 5.0% |
| Indonesians | 95.1 /100 | #100 | Exceptional 5.0% |