Immigrants from Saudi Arabia vs Immigrants from the Azores Female Unemployment
COMPARE
Immigrants from Saudi Arabia
Immigrants from the Azores
Female Unemployment
Female Unemployment Comparison
Immigrants from Saudi Arabia
Immigrants from the Azores
5.1%
FEMALE UNEMPLOYMENT
91.2/ 100
METRIC RATING
113th/ 347
METRIC RANK
5.8%
FEMALE UNEMPLOYMENT
0.1/ 100
METRIC RATING
263rd/ 347
METRIC RANK
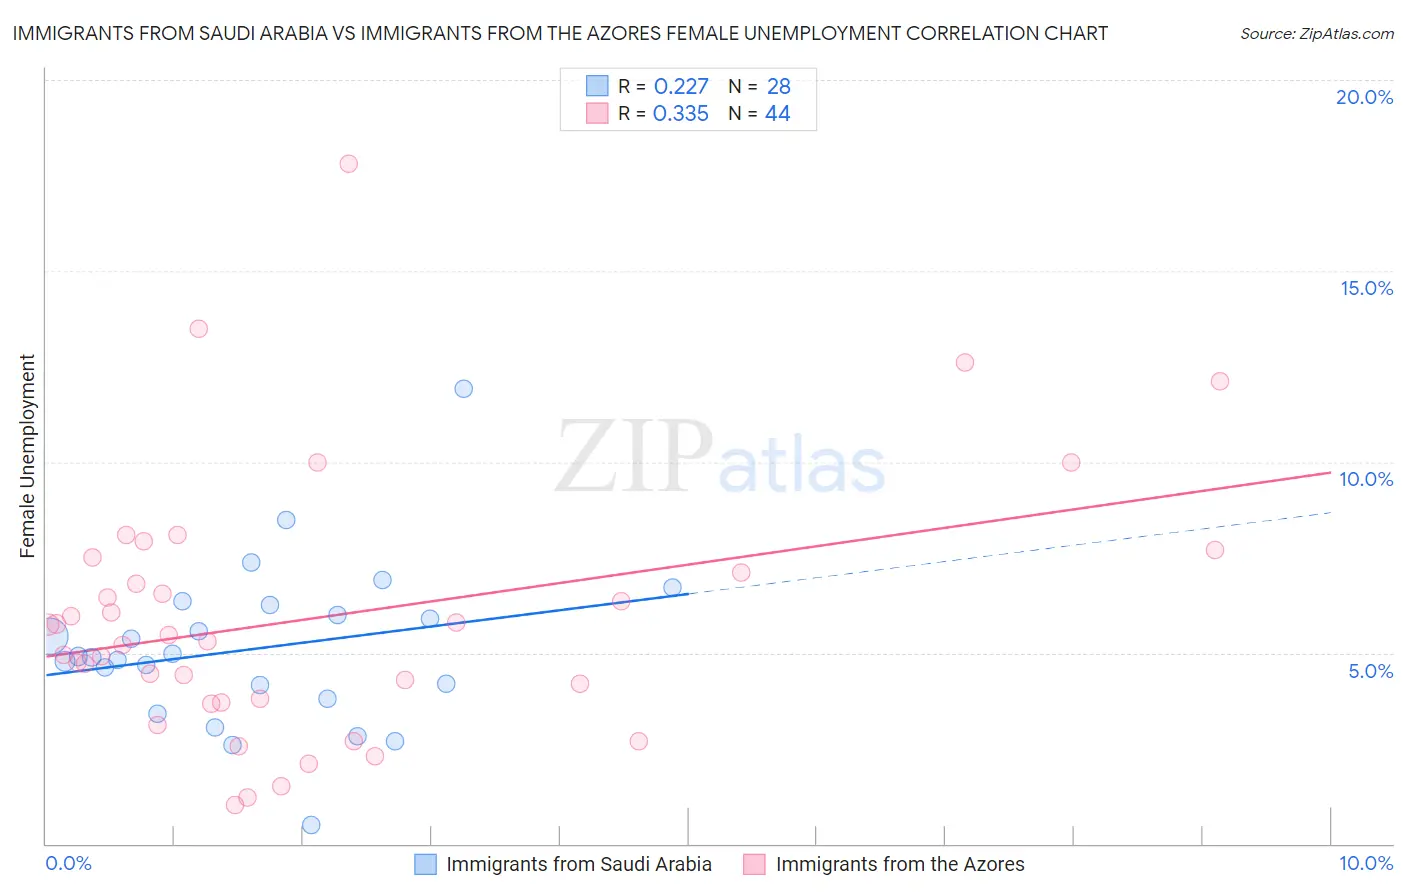
Immigrants from Saudi Arabia vs Immigrants from the Azores Female Unemployment Correlation Chart
The statistical analysis conducted on geographies consisting of 164,209,507 people shows a weak positive correlation between the proportion of Immigrants from Saudi Arabia and unemploymnet rate among females in the United States with a correlation coefficient (R) of 0.227 and weighted average of 5.1%. Similarly, the statistical analysis conducted on geographies consisting of 46,148,620 people shows a mild positive correlation between the proportion of Immigrants from the Azores and unemploymnet rate among females in the United States with a correlation coefficient (R) of 0.335 and weighted average of 5.8%, a difference of 14.6%.
Female Unemployment Correlation Summary
| Measurement | Immigrants from Saudi Arabia | Immigrants from the Azores |
| Minimum | 0.50% | 1.0% |
| Maximum | 11.9% | 17.8% |
| Range | 11.4% | 16.8% |
| Mean | 5.1% | 5.9% |
| Median | 4.9% | 5.4% |
| Interquartile 25% (IQ1) | 4.0% | 3.7% |
| Interquartile 75% (IQ3) | 6.1% | 7.3% |
| Interquartile Range (IQR) | 2.1% | 3.6% |
| Standard Deviation (Sample) | 2.1% | 3.4% |
| Standard Deviation (Population) | 2.1% | 3.4% |
Similar Demographics by Female Unemployment
Demographics Similar to Immigrants from Saudi Arabia by Female Unemployment
In terms of female unemployment, the demographic groups most similar to Immigrants from Saudi Arabia are Immigrants from Turkey (5.1%, a difference of 0.040%), Lebanese (5.1%, a difference of 0.050%), American (5.1%, a difference of 0.13%), Estonian (5.1%, a difference of 0.18%), and Jordanian (5.1%, a difference of 0.18%).
| Demographics | Rating | Rank | Female Unemployment |
| Paraguayans | 93.2 /100 | #106 | Exceptional 5.1% |
| Immigrants | Switzerland | 93.1 /100 | #107 | Exceptional 5.1% |
| Puget Sound Salish | 93.0 /100 | #108 | Exceptional 5.1% |
| Immigrants | Eastern Africa | 92.8 /100 | #109 | Exceptional 5.1% |
| Macedonians | 92.4 /100 | #110 | Exceptional 5.1% |
| Immigrants | Burma/Myanmar | 92.3 /100 | #111 | Exceptional 5.1% |
| Estonians | 92.1 /100 | #112 | Exceptional 5.1% |
| Immigrants | Saudi Arabia | 91.2 /100 | #113 | Exceptional 5.1% |
| Immigrants | Turkey | 91.0 /100 | #114 | Exceptional 5.1% |
| Lebanese | 91.0 /100 | #115 | Exceptional 5.1% |
| Americans | 90.5 /100 | #116 | Exceptional 5.1% |
| Jordanians | 90.3 /100 | #117 | Exceptional 5.1% |
| Immigrants | Croatia | 89.9 /100 | #118 | Excellent 5.1% |
| Immigrants | North Macedonia | 88.3 /100 | #119 | Excellent 5.1% |
| Immigrants | Romania | 88.1 /100 | #120 | Excellent 5.1% |
Demographics Similar to Immigrants from the Azores by Female Unemployment
In terms of female unemployment, the demographic groups most similar to Immigrants from the Azores are Immigrants from Bahamas (5.8%, a difference of 0.39%), Immigrants from Nigeria (5.8%, a difference of 0.67%), Kiowa (5.8%, a difference of 0.71%), Blackfeet (5.9%, a difference of 0.79%), and Nigerian (5.8%, a difference of 0.97%).
| Demographics | Rating | Rank | Female Unemployment |
| Sub-Saharan Africans | 0.4 /100 | #256 | Tragic 5.7% |
| Dutch West Indians | 0.3 /100 | #257 | Tragic 5.7% |
| Immigrants | Portugal | 0.2 /100 | #258 | Tragic 5.8% |
| Immigrants | Fiji | 0.2 /100 | #259 | Tragic 5.8% |
| Nigerians | 0.2 /100 | #260 | Tragic 5.8% |
| Kiowa | 0.1 /100 | #261 | Tragic 5.8% |
| Immigrants | Nigeria | 0.1 /100 | #262 | Tragic 5.8% |
| Immigrants | Azores | 0.1 /100 | #263 | Tragic 5.8% |
| Immigrants | Bahamas | 0.1 /100 | #264 | Tragic 5.8% |
| Blackfeet | 0.0 /100 | #265 | Tragic 5.9% |
| Cape Verdeans | 0.0 /100 | #266 | Tragic 5.9% |
| Nepalese | 0.0 /100 | #267 | Tragic 5.9% |
| Hondurans | 0.0 /100 | #268 | Tragic 5.9% |
| Immigrants | Western Africa | 0.0 /100 | #269 | Tragic 5.9% |
| Immigrants | Honduras | 0.0 /100 | #270 | Tragic 5.9% |