Peruvian vs Immigrants from Austria Female Unemployment
COMPARE
Peruvian
Immigrants from Austria
Female Unemployment
Female Unemployment Comparison
Peruvians
Immigrants from Austria
5.4%
FEMALE UNEMPLOYMENT
9.6/ 100
METRIC RATING
217th/ 347
METRIC RANK
5.0%
FEMALE UNEMPLOYMENT
95.7/ 100
METRIC RATING
93rd/ 347
METRIC RANK
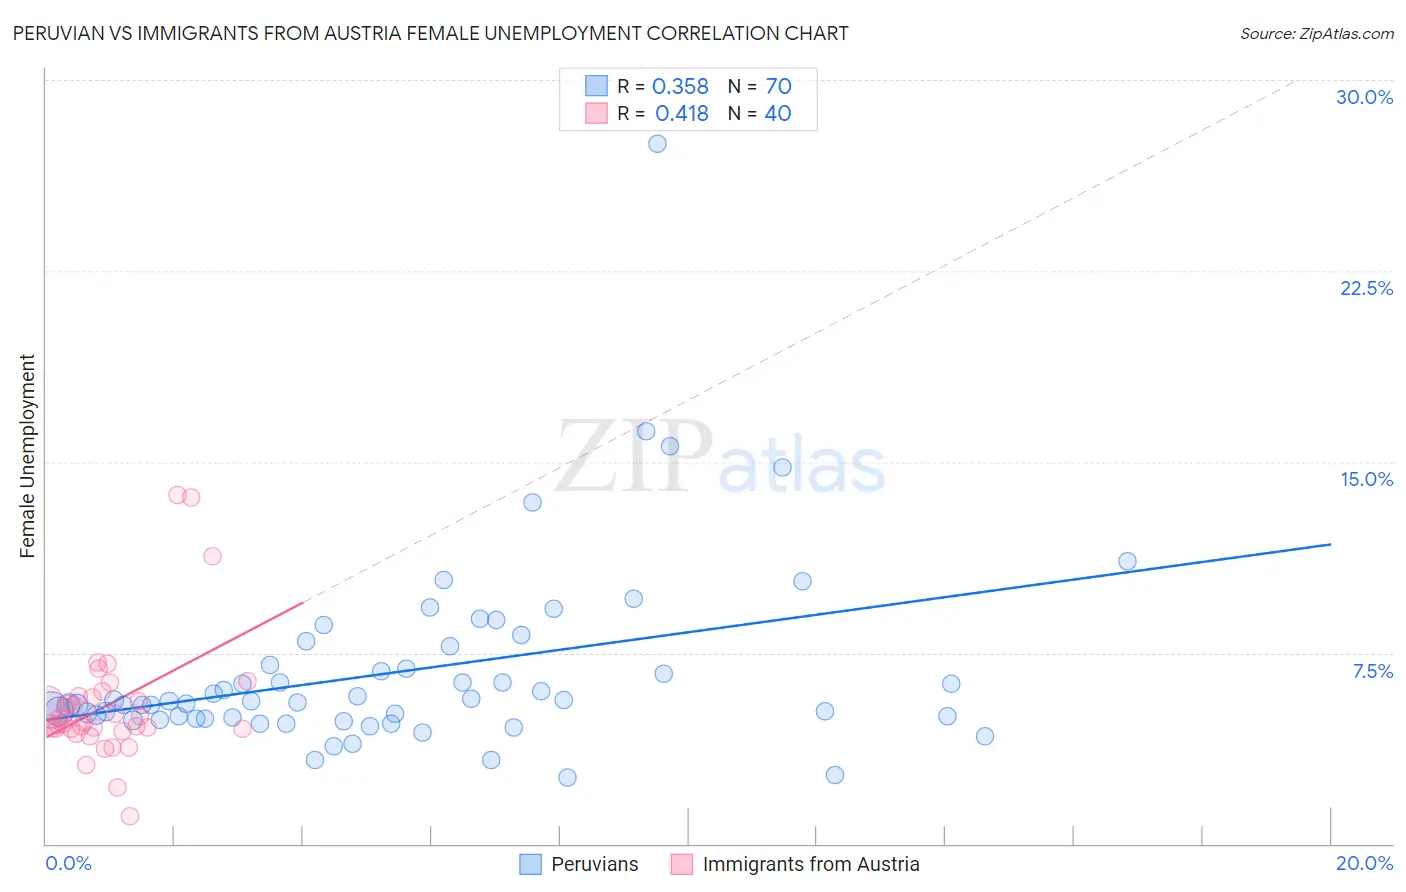
Peruvian vs Immigrants from Austria Female Unemployment Correlation Chart
The statistical analysis conducted on geographies consisting of 362,221,482 people shows a mild positive correlation between the proportion of Peruvians and unemploymnet rate among females in the United States with a correlation coefficient (R) of 0.358 and weighted average of 5.4%. Similarly, the statistical analysis conducted on geographies consisting of 167,645,945 people shows a moderate positive correlation between the proportion of Immigrants from Austria and unemploymnet rate among females in the United States with a correlation coefficient (R) of 0.418 and weighted average of 5.0%, a difference of 8.4%.
Female Unemployment Correlation Summary
| Measurement | Peruvian | Immigrants from Austria |
| Minimum | 2.6% | 1.1% |
| Maximum | 27.5% | 13.7% |
| Range | 24.9% | 12.6% |
| Mean | 6.8% | 5.5% |
| Median | 5.6% | 4.8% |
| Interquartile 25% (IQ1) | 4.9% | 4.5% |
| Interquartile 75% (IQ3) | 7.0% | 5.8% |
| Interquartile Range (IQR) | 2.1% | 1.3% |
| Standard Deviation (Sample) | 3.7% | 2.5% |
| Standard Deviation (Population) | 3.7% | 2.4% |
Similar Demographics by Female Unemployment
Demographics Similar to Peruvians by Female Unemployment
In terms of female unemployment, the demographic groups most similar to Peruvians are Comanche (5.4%, a difference of 0.070%), Immigrants from Nicaragua (5.4%, a difference of 0.10%), Bermudan (5.4%, a difference of 0.10%), Seminole (5.4%, a difference of 0.12%), and Samoan (5.4%, a difference of 0.17%).
| Demographics | Rating | Rank | Female Unemployment |
| Choctaw | 12.3 /100 | #210 | Poor 5.4% |
| Ottawa | 11.6 /100 | #211 | Poor 5.4% |
| Uruguayans | 11.4 /100 | #212 | Poor 5.4% |
| Samoans | 10.6 /100 | #213 | Poor 5.4% |
| Seminole | 10.3 /100 | #214 | Poor 5.4% |
| Immigrants | Nicaragua | 10.2 /100 | #215 | Poor 5.4% |
| Comanche | 10.0 /100 | #216 | Poor 5.4% |
| Peruvians | 9.6 /100 | #217 | Tragic 5.4% |
| Bermudans | 9.0 /100 | #218 | Tragic 5.4% |
| South Americans | 8.6 /100 | #219 | Tragic 5.4% |
| Immigrants | Africa | 8.5 /100 | #220 | Tragic 5.4% |
| Brazilians | 7.3 /100 | #221 | Tragic 5.5% |
| Nicaraguans | 7.2 /100 | #222 | Tragic 5.5% |
| Delaware | 7.2 /100 | #223 | Tragic 5.5% |
| Iraqis | 7.1 /100 | #224 | Tragic 5.5% |
Demographics Similar to Immigrants from Austria by Female Unemployment
In terms of female unemployment, the demographic groups most similar to Immigrants from Austria are Immigrants from Malaysia (5.0%, a difference of 0.020%), Burmese (5.0%, a difference of 0.040%), Romanian (5.0%, a difference of 0.080%), Immigrants from South Central Asia (5.0%, a difference of 0.090%), and Immigrants from Japan (5.0%, a difference of 0.10%).
| Demographics | Rating | Rank | Female Unemployment |
| Bolivians | 97.1 /100 | #86 | Exceptional 5.0% |
| Venezuelans | 96.9 /100 | #87 | Exceptional 5.0% |
| Immigrants | Sudan | 96.7 /100 | #88 | Exceptional 5.0% |
| Immigrants | Taiwan | 96.6 /100 | #89 | Exceptional 5.0% |
| Immigrants | Sweden | 96.3 /100 | #90 | Exceptional 5.0% |
| Immigrants | Japan | 96.0 /100 | #91 | Exceptional 5.0% |
| Romanians | 95.9 /100 | #92 | Exceptional 5.0% |
| Immigrants | Austria | 95.7 /100 | #93 | Exceptional 5.0% |
| Immigrants | Malaysia | 95.7 /100 | #94 | Exceptional 5.0% |
| Burmese | 95.6 /100 | #95 | Exceptional 5.0% |
| Immigrants | South Central Asia | 95.5 /100 | #96 | Exceptional 5.0% |
| Immigrants | Somalia | 95.2 /100 | #97 | Exceptional 5.0% |
| Immigrants | Kuwait | 95.2 /100 | #98 | Exceptional 5.0% |
| Immigrants | Zaire | 95.2 /100 | #99 | Exceptional 5.0% |
| Indonesians | 95.1 /100 | #100 | Exceptional 5.0% |