Immigrants from Saudi Arabia vs Alaskan Athabascan Female Unemployment
COMPARE
Immigrants from Saudi Arabia
Alaskan Athabascan
Female Unemployment
Female Unemployment Comparison
Immigrants from Saudi Arabia
Alaskan Athabascans
5.1%
FEMALE UNEMPLOYMENT
91.2/ 100
METRIC RATING
113th/ 347
METRIC RANK
6.1%
FEMALE UNEMPLOYMENT
0.0/ 100
METRIC RATING
296th/ 347
METRIC RANK
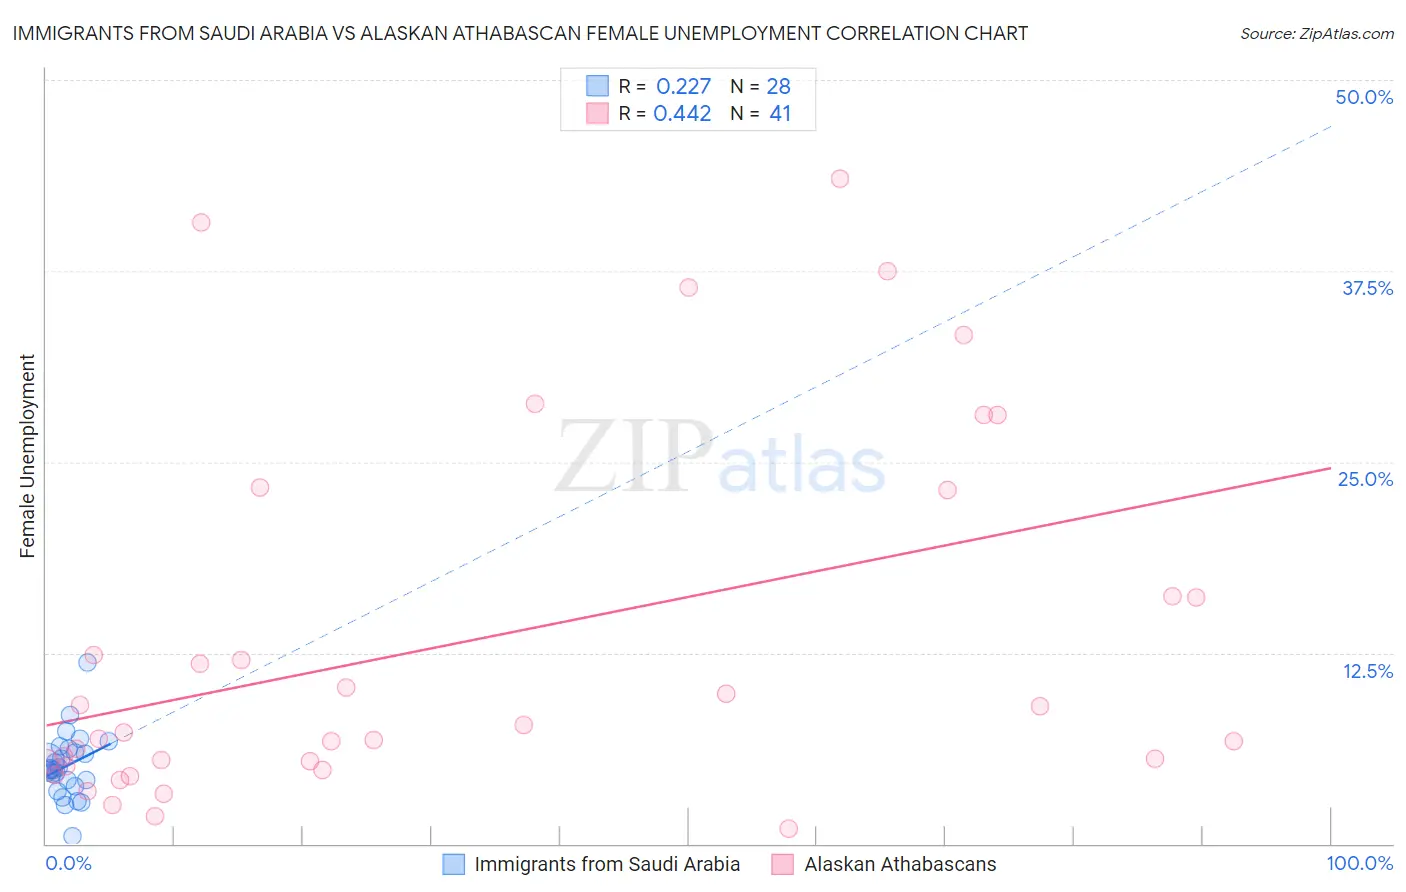
Immigrants from Saudi Arabia vs Alaskan Athabascan Female Unemployment Correlation Chart
The statistical analysis conducted on geographies consisting of 164,209,507 people shows a weak positive correlation between the proportion of Immigrants from Saudi Arabia and unemploymnet rate among females in the United States with a correlation coefficient (R) of 0.227 and weighted average of 5.1%. Similarly, the statistical analysis conducted on geographies consisting of 45,741,943 people shows a moderate positive correlation between the proportion of Alaskan Athabascans and unemploymnet rate among females in the United States with a correlation coefficient (R) of 0.442 and weighted average of 6.1%, a difference of 20.7%.
Female Unemployment Correlation Summary
| Measurement | Immigrants from Saudi Arabia | Alaskan Athabascan |
| Minimum | 0.50% | 1.0% |
| Maximum | 11.9% | 43.5% |
| Range | 11.4% | 42.5% |
| Mean | 5.1% | 13.2% |
| Median | 4.9% | 7.3% |
| Interquartile 25% (IQ1) | 4.0% | 5.2% |
| Interquartile 75% (IQ3) | 6.1% | 19.7% |
| Interquartile Range (IQR) | 2.1% | 14.4% |
| Standard Deviation (Sample) | 2.1% | 11.9% |
| Standard Deviation (Population) | 2.1% | 11.8% |
Similar Demographics by Female Unemployment
Demographics Similar to Immigrants from Saudi Arabia by Female Unemployment
In terms of female unemployment, the demographic groups most similar to Immigrants from Saudi Arabia are Immigrants from Turkey (5.1%, a difference of 0.040%), Lebanese (5.1%, a difference of 0.050%), American (5.1%, a difference of 0.13%), Estonian (5.1%, a difference of 0.18%), and Jordanian (5.1%, a difference of 0.18%).
| Demographics | Rating | Rank | Female Unemployment |
| Paraguayans | 93.2 /100 | #106 | Exceptional 5.1% |
| Immigrants | Switzerland | 93.1 /100 | #107 | Exceptional 5.1% |
| Puget Sound Salish | 93.0 /100 | #108 | Exceptional 5.1% |
| Immigrants | Eastern Africa | 92.8 /100 | #109 | Exceptional 5.1% |
| Macedonians | 92.4 /100 | #110 | Exceptional 5.1% |
| Immigrants | Burma/Myanmar | 92.3 /100 | #111 | Exceptional 5.1% |
| Estonians | 92.1 /100 | #112 | Exceptional 5.1% |
| Immigrants | Saudi Arabia | 91.2 /100 | #113 | Exceptional 5.1% |
| Immigrants | Turkey | 91.0 /100 | #114 | Exceptional 5.1% |
| Lebanese | 91.0 /100 | #115 | Exceptional 5.1% |
| Americans | 90.5 /100 | #116 | Exceptional 5.1% |
| Jordanians | 90.3 /100 | #117 | Exceptional 5.1% |
| Immigrants | Croatia | 89.9 /100 | #118 | Excellent 5.1% |
| Immigrants | North Macedonia | 88.3 /100 | #119 | Excellent 5.1% |
| Immigrants | Romania | 88.1 /100 | #120 | Excellent 5.1% |
Demographics Similar to Alaskan Athabascans by Female Unemployment
In terms of female unemployment, the demographic groups most similar to Alaskan Athabascans are West Indian (6.1%, a difference of 0.010%), Immigrants from Latin America (6.1%, a difference of 0.020%), Jamaican (6.1%, a difference of 0.030%), Immigrants from El Salvador (6.1%, a difference of 0.12%), and Ute (6.1%, a difference of 0.13%).
| Demographics | Rating | Rank | Female Unemployment |
| Trinidadians and Tobagonians | 0.0 /100 | #289 | Tragic 6.1% |
| Immigrants | Caribbean | 0.0 /100 | #290 | Tragic 6.1% |
| Immigrants | West Indies | 0.0 /100 | #291 | Tragic 6.1% |
| Immigrants | Trinidad and Tobago | 0.0 /100 | #292 | Tragic 6.1% |
| Mexicans | 0.0 /100 | #293 | Tragic 6.1% |
| Immigrants | El Salvador | 0.0 /100 | #294 | Tragic 6.1% |
| Immigrants | Latin America | 0.0 /100 | #295 | Tragic 6.1% |
| Alaskan Athabascans | 0.0 /100 | #296 | Tragic 6.1% |
| West Indians | 0.0 /100 | #297 | Tragic 6.1% |
| Jamaicans | 0.0 /100 | #298 | Tragic 6.1% |
| Ute | 0.0 /100 | #299 | Tragic 6.1% |
| Immigrants | Haiti | 0.0 /100 | #300 | Tragic 6.1% |
| Immigrants | Barbados | 0.0 /100 | #301 | Tragic 6.2% |
| U.S. Virgin Islanders | 0.0 /100 | #302 | Tragic 6.2% |
| Barbadians | 0.0 /100 | #303 | Tragic 6.2% |