Scottish vs Immigrants from Austria Female Unemployment
COMPARE
Scottish
Immigrants from Austria
Female Unemployment
Female Unemployment Comparison
Scottish
Immigrants from Austria
4.7%
FEMALE UNEMPLOYMENT
99.9/ 100
METRIC RATING
23rd/ 347
METRIC RANK
5.0%
FEMALE UNEMPLOYMENT
95.7/ 100
METRIC RATING
93rd/ 347
METRIC RANK
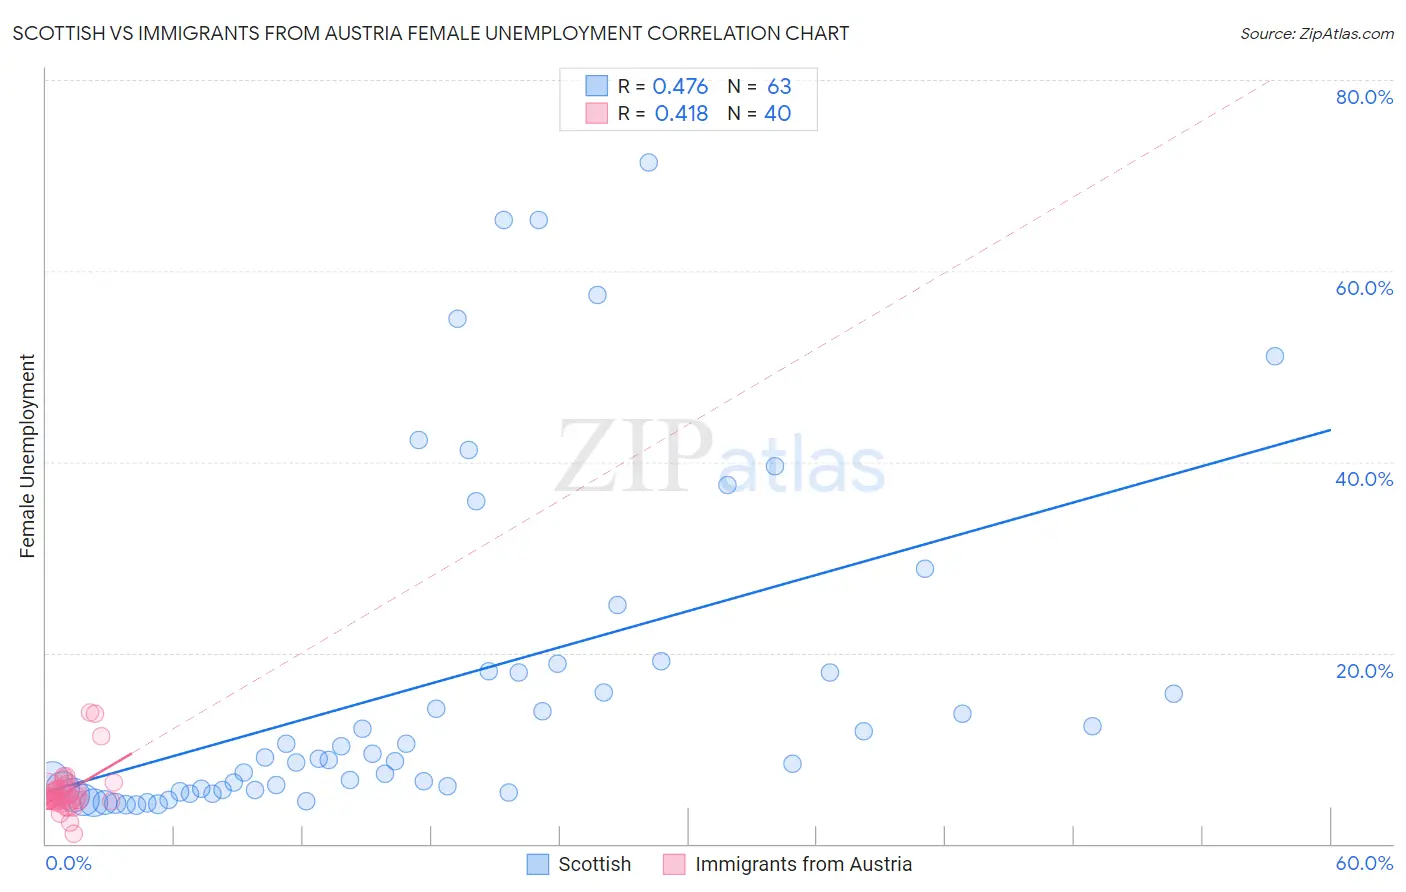
Scottish vs Immigrants from Austria Female Unemployment Correlation Chart
The statistical analysis conducted on geographies consisting of 553,178,597 people shows a moderate positive correlation between the proportion of Scottish and unemploymnet rate among females in the United States with a correlation coefficient (R) of 0.476 and weighted average of 4.7%. Similarly, the statistical analysis conducted on geographies consisting of 167,645,945 people shows a moderate positive correlation between the proportion of Immigrants from Austria and unemploymnet rate among females in the United States with a correlation coefficient (R) of 0.418 and weighted average of 5.0%, a difference of 6.3%.
Female Unemployment Correlation Summary
| Measurement | Scottish | Immigrants from Austria |
| Minimum | 4.1% | 1.1% |
| Maximum | 71.4% | 13.7% |
| Range | 67.3% | 12.6% |
| Mean | 16.8% | 5.5% |
| Median | 8.9% | 4.8% |
| Interquartile 25% (IQ1) | 5.6% | 4.5% |
| Interquartile 75% (IQ3) | 18.0% | 5.8% |
| Interquartile Range (IQR) | 12.5% | 1.3% |
| Standard Deviation (Sample) | 17.5% | 2.5% |
| Standard Deviation (Population) | 17.4% | 2.4% |
Similar Demographics by Female Unemployment
Demographics Similar to Scottish by Female Unemployment
In terms of female unemployment, the demographic groups most similar to Scottish are Welsh (4.7%, a difference of 0.21%), Immigrants from India (4.7%, a difference of 0.29%), Immigrants from Bosnia and Herzegovina (4.7%, a difference of 0.33%), British (4.7%, a difference of 0.50%), and Irish (4.7%, a difference of 0.53%).
| Demographics | Rating | Rank | Female Unemployment |
| Carpatho Rusyns | 99.9 /100 | #16 | Exceptional 4.7% |
| Croatians | 99.9 /100 | #17 | Exceptional 4.7% |
| Latvians | 99.9 /100 | #18 | Exceptional 4.7% |
| Poles | 99.9 /100 | #19 | Exceptional 4.7% |
| Bulgarians | 99.9 /100 | #20 | Exceptional 4.7% |
| Fijians | 99.9 /100 | #21 | Exceptional 4.7% |
| Europeans | 99.9 /100 | #22 | Exceptional 4.7% |
| Scottish | 99.9 /100 | #23 | Exceptional 4.7% |
| Welsh | 99.9 /100 | #24 | Exceptional 4.7% |
| Immigrants | India | 99.9 /100 | #25 | Exceptional 4.7% |
| Immigrants | Bosnia and Herzegovina | 99.9 /100 | #26 | Exceptional 4.7% |
| British | 99.9 /100 | #27 | Exceptional 4.7% |
| Irish | 99.9 /100 | #28 | Exceptional 4.7% |
| Cypriots | 99.9 /100 | #29 | Exceptional 4.7% |
| Lithuanians | 99.8 /100 | #30 | Exceptional 4.7% |
Demographics Similar to Immigrants from Austria by Female Unemployment
In terms of female unemployment, the demographic groups most similar to Immigrants from Austria are Immigrants from Malaysia (5.0%, a difference of 0.020%), Burmese (5.0%, a difference of 0.040%), Romanian (5.0%, a difference of 0.080%), Immigrants from South Central Asia (5.0%, a difference of 0.090%), and Immigrants from Japan (5.0%, a difference of 0.10%).
| Demographics | Rating | Rank | Female Unemployment |
| Bolivians | 97.1 /100 | #86 | Exceptional 5.0% |
| Venezuelans | 96.9 /100 | #87 | Exceptional 5.0% |
| Immigrants | Sudan | 96.7 /100 | #88 | Exceptional 5.0% |
| Immigrants | Taiwan | 96.6 /100 | #89 | Exceptional 5.0% |
| Immigrants | Sweden | 96.3 /100 | #90 | Exceptional 5.0% |
| Immigrants | Japan | 96.0 /100 | #91 | Exceptional 5.0% |
| Romanians | 95.9 /100 | #92 | Exceptional 5.0% |
| Immigrants | Austria | 95.7 /100 | #93 | Exceptional 5.0% |
| Immigrants | Malaysia | 95.7 /100 | #94 | Exceptional 5.0% |
| Burmese | 95.6 /100 | #95 | Exceptional 5.0% |
| Immigrants | South Central Asia | 95.5 /100 | #96 | Exceptional 5.0% |
| Immigrants | Somalia | 95.2 /100 | #97 | Exceptional 5.0% |
| Immigrants | Kuwait | 95.2 /100 | #98 | Exceptional 5.0% |
| Immigrants | Zaire | 95.2 /100 | #99 | Exceptional 5.0% |
| Indonesians | 95.1 /100 | #100 | Exceptional 5.0% |