Canadian vs Immigrants from Austria Female Unemployment
COMPARE
Canadian
Immigrants from Austria
Female Unemployment
Female Unemployment Comparison
Canadians
Immigrants from Austria
5.0%
FEMALE UNEMPLOYMENT
97.2/ 100
METRIC RATING
84th/ 347
METRIC RANK
5.0%
FEMALE UNEMPLOYMENT
95.7/ 100
METRIC RATING
93rd/ 347
METRIC RANK
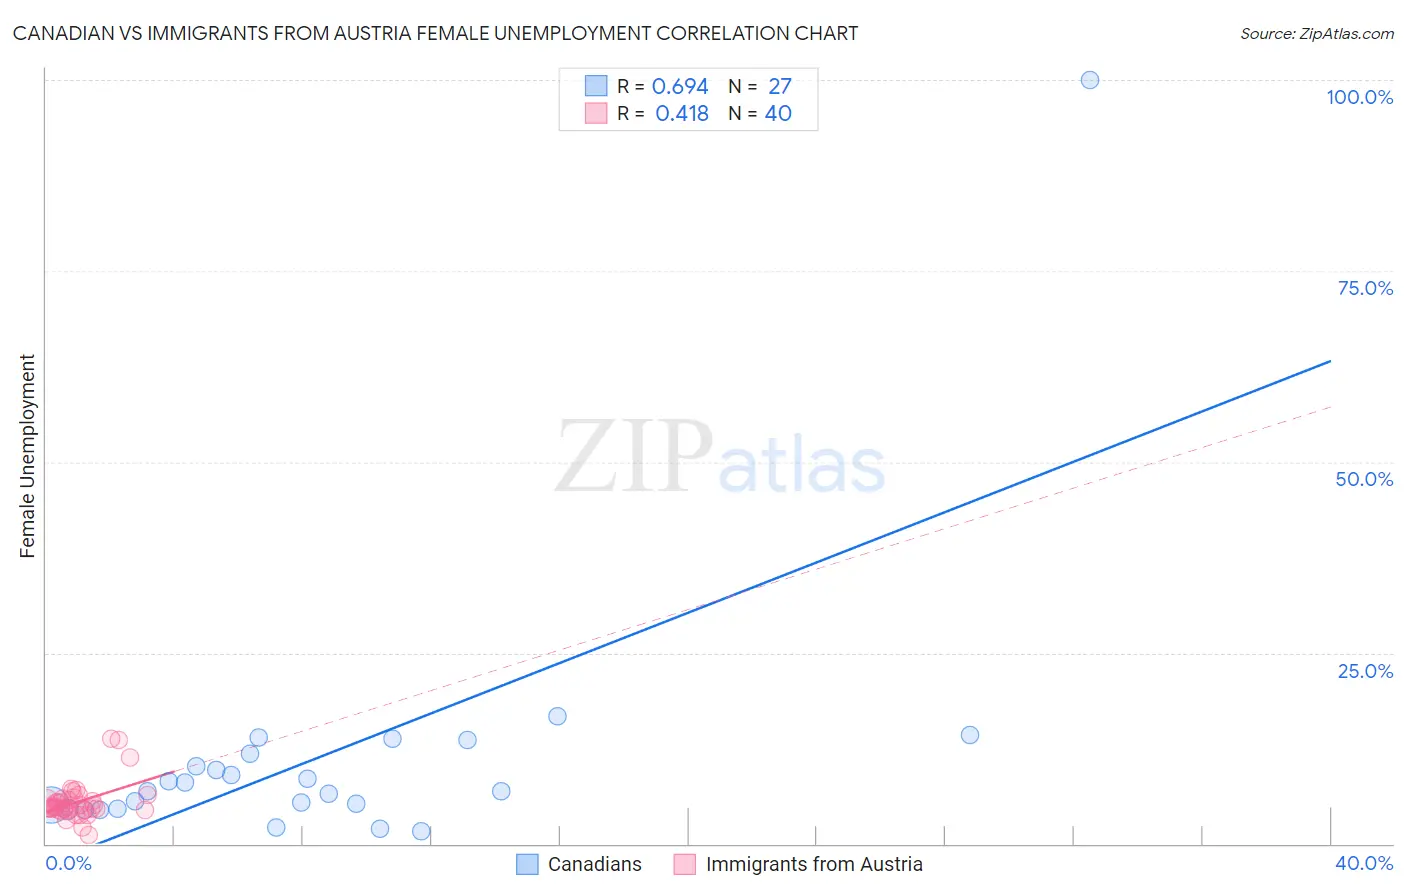
Canadian vs Immigrants from Austria Female Unemployment Correlation Chart
The statistical analysis conducted on geographies consisting of 433,816,677 people shows a significant positive correlation between the proportion of Canadians and unemploymnet rate among females in the United States with a correlation coefficient (R) of 0.694 and weighted average of 5.0%. Similarly, the statistical analysis conducted on geographies consisting of 167,645,945 people shows a moderate positive correlation between the proportion of Immigrants from Austria and unemploymnet rate among females in the United States with a correlation coefficient (R) of 0.418 and weighted average of 5.0%, a difference of 0.67%.
Female Unemployment Correlation Summary
| Measurement | Canadian | Immigrants from Austria |
| Minimum | 1.7% | 1.1% |
| Maximum | 100.0% | 13.7% |
| Range | 98.3% | 12.6% |
| Mean | 11.2% | 5.5% |
| Median | 6.9% | 4.8% |
| Interquartile 25% (IQ1) | 4.5% | 4.5% |
| Interquartile 75% (IQ3) | 11.8% | 5.8% |
| Interquartile Range (IQR) | 7.2% | 1.3% |
| Standard Deviation (Sample) | 18.2% | 2.5% |
| Standard Deviation (Population) | 17.9% | 2.4% |
Demographics Similar to Canadians and Immigrants from Austria by Female Unemployment
In terms of female unemployment, the demographic groups most similar to Canadians are Immigrants from Serbia (5.0%, a difference of 0.040%), Ukrainian (5.0%, a difference of 0.040%), Immigrants from Australia (5.0%, a difference of 0.050%), Bolivian (5.0%, a difference of 0.050%), and Filipino (5.0%, a difference of 0.10%). Similarly, the demographic groups most similar to Immigrants from Austria are Immigrants from Malaysia (5.0%, a difference of 0.020%), Burmese (5.0%, a difference of 0.040%), Romanian (5.0%, a difference of 0.080%), Immigrants from South Central Asia (5.0%, a difference of 0.090%), and Immigrants from Japan (5.0%, a difference of 0.10%).
| Demographics | Rating | Rank | Female Unemployment |
| Immigrants | Netherlands | 97.8 /100 | #78 | Exceptional 5.0% |
| Turks | 97.6 /100 | #79 | Exceptional 5.0% |
| New Zealanders | 97.4 /100 | #80 | Exceptional 5.0% |
| Filipinos | 97.3 /100 | #81 | Exceptional 5.0% |
| Immigrants | Australia | 97.3 /100 | #82 | Exceptional 5.0% |
| Immigrants | Serbia | 97.2 /100 | #83 | Exceptional 5.0% |
| Canadians | 97.2 /100 | #84 | Exceptional 5.0% |
| Ukrainians | 97.1 /100 | #85 | Exceptional 5.0% |
| Bolivians | 97.1 /100 | #86 | Exceptional 5.0% |
| Venezuelans | 96.9 /100 | #87 | Exceptional 5.0% |
| Immigrants | Sudan | 96.7 /100 | #88 | Exceptional 5.0% |
| Immigrants | Taiwan | 96.6 /100 | #89 | Exceptional 5.0% |
| Immigrants | Sweden | 96.3 /100 | #90 | Exceptional 5.0% |
| Immigrants | Japan | 96.0 /100 | #91 | Exceptional 5.0% |
| Romanians | 95.9 /100 | #92 | Exceptional 5.0% |
| Immigrants | Austria | 95.7 /100 | #93 | Exceptional 5.0% |
| Immigrants | Malaysia | 95.7 /100 | #94 | Exceptional 5.0% |
| Burmese | 95.6 /100 | #95 | Exceptional 5.0% |
| Immigrants | South Central Asia | 95.5 /100 | #96 | Exceptional 5.0% |
| Immigrants | Somalia | 95.2 /100 | #97 | Exceptional 5.0% |
| Immigrants | Kuwait | 95.2 /100 | #98 | Exceptional 5.0% |