Immigrants from Russia vs Immigrants from Laos Unemployment Among Women with Children Ages 6 to 17 years
COMPARE
Immigrants from Russia
Immigrants from Laos
Unemployment Among Women with Children Ages 6 to 17 years
Unemployment Among Women with Children Ages 6 to 17 years Comparison
Immigrants from Russia
Immigrants from Laos
8.6%
UNEMPLOYMENT AMONG WOMEN WITH CHILDREN AGES 6 TO 17 YEARS
96.7/ 100
METRIC RATING
114th/ 347
METRIC RANK
8.2%
UNEMPLOYMENT AMONG WOMEN WITH CHILDREN AGES 6 TO 17 YEARS
100.0/ 100
METRIC RATING
57th/ 347
METRIC RANK
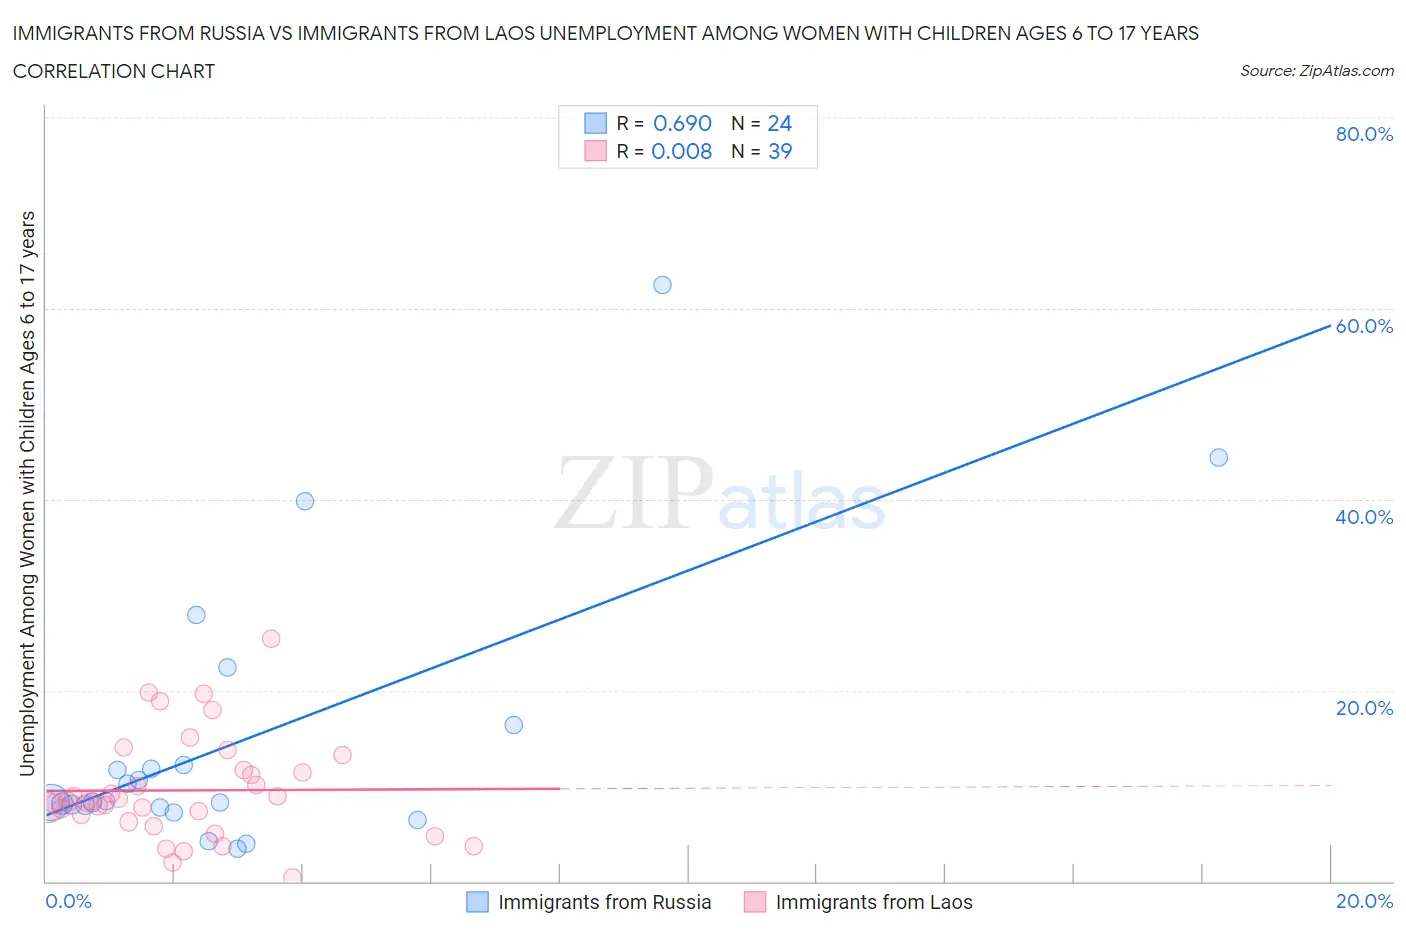
Immigrants from Russia vs Immigrants from Laos Unemployment Among Women with Children Ages 6 to 17 years Correlation Chart
The statistical analysis conducted on geographies consisting of 252,369,687 people shows a significant positive correlation between the proportion of Immigrants from Russia and unemployment rate among women with children between the ages 6 and 17 in the United States with a correlation coefficient (R) of 0.690 and weighted average of 8.6%. Similarly, the statistical analysis conducted on geographies consisting of 166,241,149 people shows no correlation between the proportion of Immigrants from Laos and unemployment rate among women with children between the ages 6 and 17 in the United States with a correlation coefficient (R) of 0.008 and weighted average of 8.2%, a difference of 5.7%.
Unemployment Among Women with Children Ages 6 to 17 years Correlation Summary
| Measurement | Immigrants from Russia | Immigrants from Laos |
| Minimum | 3.4% | 0.40% |
| Maximum | 62.5% | 25.3% |
| Range | 59.1% | 24.9% |
| Mean | 15.0% | 9.5% |
| Median | 8.4% | 8.4% |
| Interquartile 25% (IQ1) | 7.8% | 6.2% |
| Interquartile 75% (IQ3) | 14.3% | 11.6% |
| Interquartile Range (IQR) | 6.5% | 5.4% |
| Standard Deviation (Sample) | 14.6% | 5.4% |
| Standard Deviation (Population) | 14.3% | 5.3% |
Similar Demographics by Unemployment Among Women with Children Ages 6 to 17 years
Demographics Similar to Immigrants from Russia by Unemployment Among Women with Children Ages 6 to 17 years
In terms of unemployment among women with children ages 6 to 17 years, the demographic groups most similar to Immigrants from Russia are Eastern European (8.6%, a difference of 0.010%), Argentinean (8.6%, a difference of 0.070%), Zimbabwean (8.6%, a difference of 0.14%), Albanian (8.6%, a difference of 0.15%), and Romanian (8.6%, a difference of 0.16%).
| Demographics | Rating | Rank | Unemployment Among Women with Children Ages 6 to 17 years |
| Chickasaw | 97.6 /100 | #107 | Exceptional 8.6% |
| Swedes | 97.6 /100 | #108 | Exceptional 8.6% |
| Immigrants | Romania | 97.5 /100 | #109 | Exceptional 8.6% |
| Latvians | 97.4 /100 | #110 | Exceptional 8.6% |
| Immigrants | Ukraine | 97.4 /100 | #111 | Exceptional 8.6% |
| Romanians | 97.1 /100 | #112 | Exceptional 8.6% |
| Eastern Europeans | 96.8 /100 | #113 | Exceptional 8.6% |
| Immigrants | Russia | 96.7 /100 | #114 | Exceptional 8.6% |
| Argentineans | 96.5 /100 | #115 | Exceptional 8.6% |
| Zimbabweans | 96.3 /100 | #116 | Exceptional 8.6% |
| Albanians | 96.3 /100 | #117 | Exceptional 8.6% |
| Pueblo | 96.2 /100 | #118 | Exceptional 8.6% |
| Immigrants | Grenada | 96.2 /100 | #119 | Exceptional 8.6% |
| Israelis | 95.9 /100 | #120 | Exceptional 8.7% |
| Immigrants | Denmark | 95.5 /100 | #121 | Exceptional 8.7% |
Demographics Similar to Immigrants from Laos by Unemployment Among Women with Children Ages 6 to 17 years
In terms of unemployment among women with children ages 6 to 17 years, the demographic groups most similar to Immigrants from Laos are Immigrants from Bosnia and Herzegovina (8.2%, a difference of 0.020%), Immigrants from Japan (8.2%, a difference of 0.030%), Immigrants from Armenia (8.2%, a difference of 0.10%), Immigrants from Malaysia (8.2%, a difference of 0.19%), and Immigrants from Philippines (8.2%, a difference of 0.26%).
| Demographics | Rating | Rank | Unemployment Among Women with Children Ages 6 to 17 years |
| Hawaiians | 100.0 /100 | #50 | Exceptional 8.1% |
| Immigrants | Sudan | 100.0 /100 | #51 | Exceptional 8.1% |
| Immigrants | Iraq | 100.0 /100 | #52 | Exceptional 8.1% |
| Danes | 100.0 /100 | #53 | Exceptional 8.1% |
| Immigrants | Armenia | 100.0 /100 | #54 | Exceptional 8.2% |
| Immigrants | Japan | 100.0 /100 | #55 | Exceptional 8.2% |
| Immigrants | Bosnia and Herzegovina | 100.0 /100 | #56 | Exceptional 8.2% |
| Immigrants | Laos | 100.0 /100 | #57 | Exceptional 8.2% |
| Immigrants | Malaysia | 100.0 /100 | #58 | Exceptional 8.2% |
| Immigrants | Philippines | 100.0 /100 | #59 | Exceptional 8.2% |
| Basques | 100.0 /100 | #60 | Exceptional 8.2% |
| Koreans | 100.0 /100 | #61 | Exceptional 8.2% |
| Spanish American Indians | 100.0 /100 | #62 | Exceptional 8.2% |
| Immigrants | South Eastern Asia | 99.9 /100 | #63 | Exceptional 8.2% |
| Immigrants | Kuwait | 99.9 /100 | #64 | Exceptional 8.3% |