Immigrants from Russia vs Immigrants from Thailand Unemployment Among Women with Children Ages 6 to 17 years
COMPARE
Immigrants from Russia
Immigrants from Thailand
Unemployment Among Women with Children Ages 6 to 17 years
Unemployment Among Women with Children Ages 6 to 17 years Comparison
Immigrants from Russia
Immigrants from Thailand
8.6%
UNEMPLOYMENT AMONG WOMEN WITH CHILDREN AGES 6 TO 17 YEARS
96.7/ 100
METRIC RATING
114th/ 347
METRIC RANK
8.3%
UNEMPLOYMENT AMONG WOMEN WITH CHILDREN AGES 6 TO 17 YEARS
99.9/ 100
METRIC RATING
69th/ 347
METRIC RANK
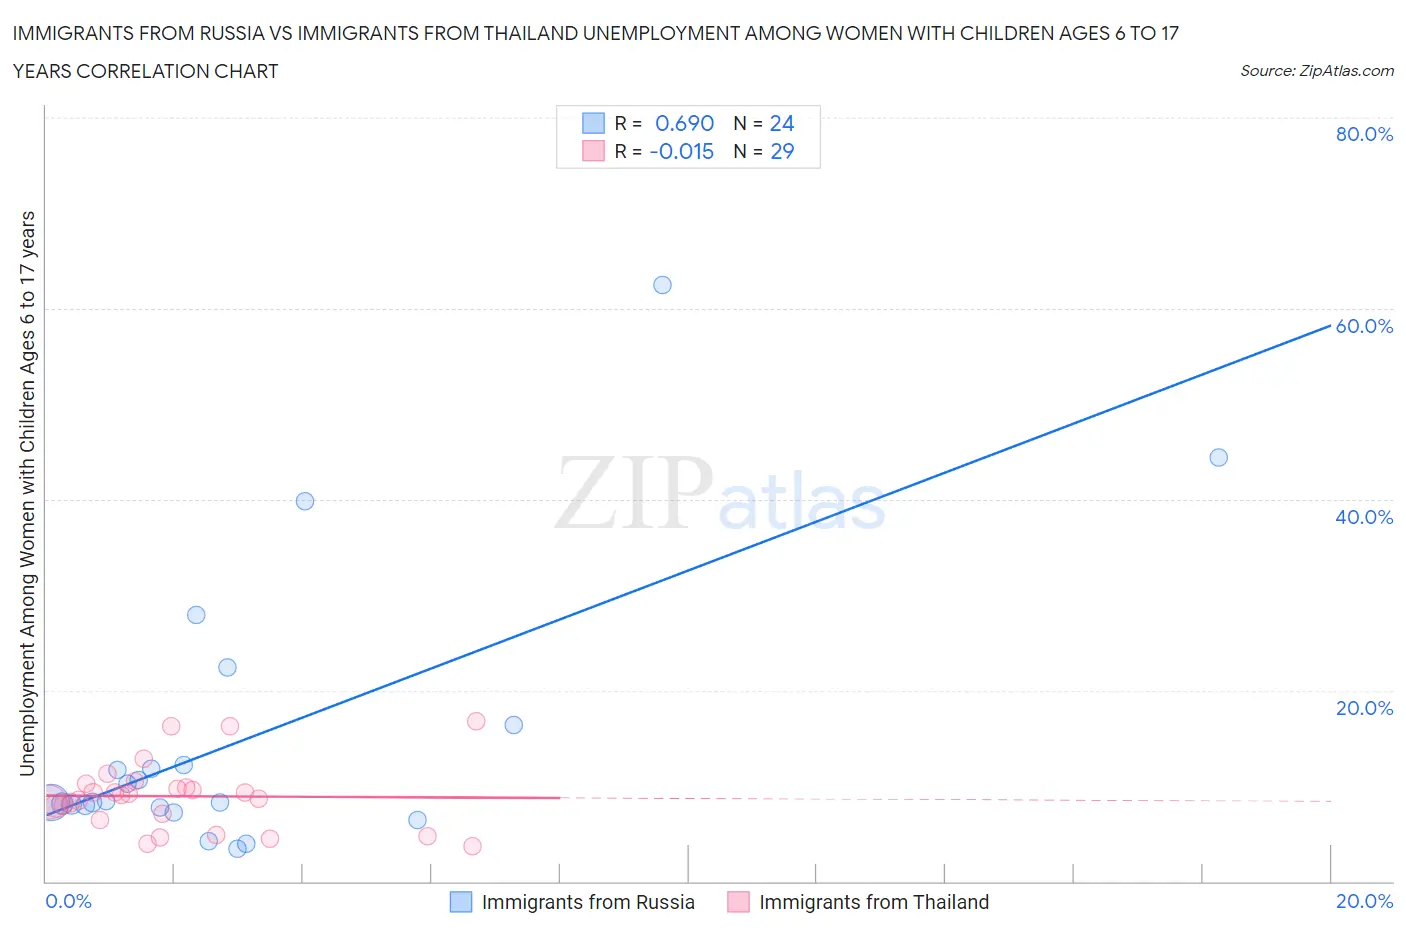
Immigrants from Russia vs Immigrants from Thailand Unemployment Among Women with Children Ages 6 to 17 years Correlation Chart
The statistical analysis conducted on geographies consisting of 252,369,687 people shows a significant positive correlation between the proportion of Immigrants from Russia and unemployment rate among women with children between the ages 6 and 17 in the United States with a correlation coefficient (R) of 0.690 and weighted average of 8.6%. Similarly, the statistical analysis conducted on geographies consisting of 241,273,781 people shows no correlation between the proportion of Immigrants from Thailand and unemployment rate among women with children between the ages 6 and 17 in the United States with a correlation coefficient (R) of -0.015 and weighted average of 8.3%, a difference of 3.9%.
Unemployment Among Women with Children Ages 6 to 17 years Correlation Summary
| Measurement | Immigrants from Russia | Immigrants from Thailand |
| Minimum | 3.4% | 3.7% |
| Maximum | 62.5% | 16.7% |
| Range | 59.1% | 13.0% |
| Mean | 15.0% | 8.9% |
| Median | 8.4% | 9.0% |
| Interquartile 25% (IQ1) | 7.8% | 6.7% |
| Interquartile 75% (IQ3) | 14.3% | 10.0% |
| Interquartile Range (IQR) | 6.5% | 3.2% |
| Standard Deviation (Sample) | 14.6% | 3.5% |
| Standard Deviation (Population) | 14.3% | 3.4% |
Similar Demographics by Unemployment Among Women with Children Ages 6 to 17 years
Demographics Similar to Immigrants from Russia by Unemployment Among Women with Children Ages 6 to 17 years
In terms of unemployment among women with children ages 6 to 17 years, the demographic groups most similar to Immigrants from Russia are Eastern European (8.6%, a difference of 0.010%), Argentinean (8.6%, a difference of 0.070%), Zimbabwean (8.6%, a difference of 0.14%), Albanian (8.6%, a difference of 0.15%), and Romanian (8.6%, a difference of 0.16%).
| Demographics | Rating | Rank | Unemployment Among Women with Children Ages 6 to 17 years |
| Chickasaw | 97.6 /100 | #107 | Exceptional 8.6% |
| Swedes | 97.6 /100 | #108 | Exceptional 8.6% |
| Immigrants | Romania | 97.5 /100 | #109 | Exceptional 8.6% |
| Latvians | 97.4 /100 | #110 | Exceptional 8.6% |
| Immigrants | Ukraine | 97.4 /100 | #111 | Exceptional 8.6% |
| Romanians | 97.1 /100 | #112 | Exceptional 8.6% |
| Eastern Europeans | 96.8 /100 | #113 | Exceptional 8.6% |
| Immigrants | Russia | 96.7 /100 | #114 | Exceptional 8.6% |
| Argentineans | 96.5 /100 | #115 | Exceptional 8.6% |
| Zimbabweans | 96.3 /100 | #116 | Exceptional 8.6% |
| Albanians | 96.3 /100 | #117 | Exceptional 8.6% |
| Pueblo | 96.2 /100 | #118 | Exceptional 8.6% |
| Immigrants | Grenada | 96.2 /100 | #119 | Exceptional 8.6% |
| Israelis | 95.9 /100 | #120 | Exceptional 8.7% |
| Immigrants | Denmark | 95.5 /100 | #121 | Exceptional 8.7% |
Demographics Similar to Immigrants from Thailand by Unemployment Among Women with Children Ages 6 to 17 years
In terms of unemployment among women with children ages 6 to 17 years, the demographic groups most similar to Immigrants from Thailand are Marshallese (8.3%, a difference of 0.030%), Norwegian (8.3%, a difference of 0.080%), Armenian (8.3%, a difference of 0.11%), Immigrants from Australia (8.3%, a difference of 0.15%), and Immigrants from Nepal (8.3%, a difference of 0.18%).
| Demographics | Rating | Rank | Unemployment Among Women with Children Ages 6 to 17 years |
| Spanish American Indians | 100.0 /100 | #62 | Exceptional 8.2% |
| Immigrants | South Eastern Asia | 99.9 /100 | #63 | Exceptional 8.2% |
| Immigrants | Kuwait | 99.9 /100 | #64 | Exceptional 8.3% |
| Immigrants | Albania | 99.9 /100 | #65 | Exceptional 8.3% |
| Luxembourgers | 99.9 /100 | #66 | Exceptional 8.3% |
| Armenians | 99.9 /100 | #67 | Exceptional 8.3% |
| Marshallese | 99.9 /100 | #68 | Exceptional 8.3% |
| Immigrants | Thailand | 99.9 /100 | #69 | Exceptional 8.3% |
| Norwegians | 99.9 /100 | #70 | Exceptional 8.3% |
| Immigrants | Australia | 99.8 /100 | #71 | Exceptional 8.3% |
| Immigrants | Nepal | 99.8 /100 | #72 | Exceptional 8.3% |
| Spanish Americans | 99.8 /100 | #73 | Exceptional 8.4% |
| Samoans | 99.7 /100 | #74 | Exceptional 8.4% |
| Immigrants | Sri Lanka | 99.7 /100 | #75 | Exceptional 8.4% |
| Immigrants | Moldova | 99.7 /100 | #76 | Exceptional 8.4% |