Pakistani vs Immigrants from Laos Unemployment Among Women with Children Ages 6 to 17 years
COMPARE
Pakistani
Immigrants from Laos
Unemployment Among Women with Children Ages 6 to 17 years
Unemployment Among Women with Children Ages 6 to 17 years Comparison
Pakistanis
Immigrants from Laos
8.4%
UNEMPLOYMENT AMONG WOMEN WITH CHILDREN AGES 6 TO 17 YEARS
99.6/ 100
METRIC RATING
78th/ 347
METRIC RANK
8.2%
UNEMPLOYMENT AMONG WOMEN WITH CHILDREN AGES 6 TO 17 YEARS
100.0/ 100
METRIC RATING
57th/ 347
METRIC RANK
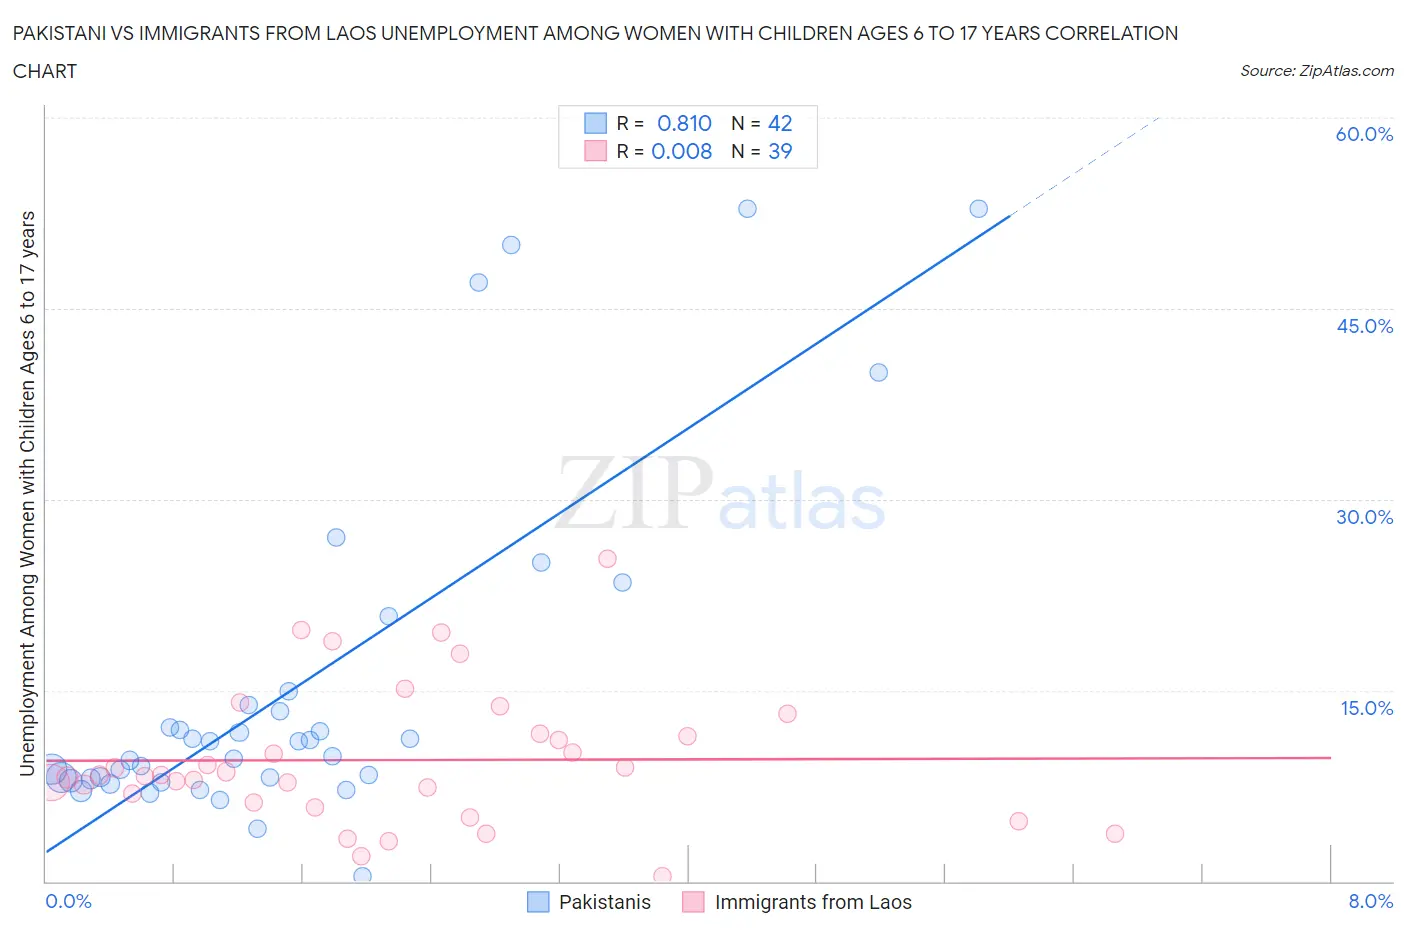
Pakistani vs Immigrants from Laos Unemployment Among Women with Children Ages 6 to 17 years Correlation Chart
The statistical analysis conducted on geographies consisting of 251,939,876 people shows a very strong positive correlation between the proportion of Pakistanis and unemployment rate among women with children between the ages 6 and 17 in the United States with a correlation coefficient (R) of 0.810 and weighted average of 8.4%. Similarly, the statistical analysis conducted on geographies consisting of 166,241,149 people shows no correlation between the proportion of Immigrants from Laos and unemployment rate among women with children between the ages 6 and 17 in the United States with a correlation coefficient (R) of 0.008 and weighted average of 8.2%, a difference of 3.0%.
Unemployment Among Women with Children Ages 6 to 17 years Correlation Summary
| Measurement | Pakistani | Immigrants from Laos |
| Minimum | 0.40% | 0.40% |
| Maximum | 52.8% | 25.3% |
| Range | 52.4% | 24.9% |
| Mean | 15.3% | 9.5% |
| Median | 10.4% | 8.4% |
| Interquartile 25% (IQ1) | 8.0% | 6.2% |
| Interquartile 75% (IQ3) | 13.8% | 11.6% |
| Interquartile Range (IQR) | 5.8% | 5.4% |
| Standard Deviation (Sample) | 13.5% | 5.4% |
| Standard Deviation (Population) | 13.3% | 5.3% |
Similar Demographics by Unemployment Among Women with Children Ages 6 to 17 years
Demographics Similar to Pakistanis by Unemployment Among Women with Children Ages 6 to 17 years
In terms of unemployment among women with children ages 6 to 17 years, the demographic groups most similar to Pakistanis are Mongolian (8.4%, a difference of 0.010%), Immigrants from Belarus (8.4%, a difference of 0.050%), Iraqi (8.4%, a difference of 0.14%), Immigrants from Bolivia (8.4%, a difference of 0.17%), and Immigrants from Moldova (8.4%, a difference of 0.19%).
| Demographics | Rating | Rank | Unemployment Among Women with Children Ages 6 to 17 years |
| Immigrants | Australia | 99.8 /100 | #71 | Exceptional 8.3% |
| Immigrants | Nepal | 99.8 /100 | #72 | Exceptional 8.3% |
| Spanish Americans | 99.8 /100 | #73 | Exceptional 8.4% |
| Samoans | 99.7 /100 | #74 | Exceptional 8.4% |
| Immigrants | Sri Lanka | 99.7 /100 | #75 | Exceptional 8.4% |
| Immigrants | Moldova | 99.7 /100 | #76 | Exceptional 8.4% |
| Iraqis | 99.7 /100 | #77 | Exceptional 8.4% |
| Pakistanis | 99.6 /100 | #78 | Exceptional 8.4% |
| Mongolians | 99.6 /100 | #79 | Exceptional 8.4% |
| Immigrants | Belarus | 99.6 /100 | #80 | Exceptional 8.4% |
| Immigrants | Bolivia | 99.6 /100 | #81 | Exceptional 8.4% |
| Cypriots | 99.6 /100 | #82 | Exceptional 8.4% |
| Bulgarians | 99.5 /100 | #83 | Exceptional 8.4% |
| Japanese | 99.5 /100 | #84 | Exceptional 8.4% |
| Immigrants | North Macedonia | 99.4 /100 | #85 | Exceptional 8.5% |
Demographics Similar to Immigrants from Laos by Unemployment Among Women with Children Ages 6 to 17 years
In terms of unemployment among women with children ages 6 to 17 years, the demographic groups most similar to Immigrants from Laos are Immigrants from Bosnia and Herzegovina (8.2%, a difference of 0.020%), Immigrants from Japan (8.2%, a difference of 0.030%), Immigrants from Armenia (8.2%, a difference of 0.10%), Immigrants from Malaysia (8.2%, a difference of 0.19%), and Immigrants from Philippines (8.2%, a difference of 0.26%).
| Demographics | Rating | Rank | Unemployment Among Women with Children Ages 6 to 17 years |
| Hawaiians | 100.0 /100 | #50 | Exceptional 8.1% |
| Immigrants | Sudan | 100.0 /100 | #51 | Exceptional 8.1% |
| Immigrants | Iraq | 100.0 /100 | #52 | Exceptional 8.1% |
| Danes | 100.0 /100 | #53 | Exceptional 8.1% |
| Immigrants | Armenia | 100.0 /100 | #54 | Exceptional 8.2% |
| Immigrants | Japan | 100.0 /100 | #55 | Exceptional 8.2% |
| Immigrants | Bosnia and Herzegovina | 100.0 /100 | #56 | Exceptional 8.2% |
| Immigrants | Laos | 100.0 /100 | #57 | Exceptional 8.2% |
| Immigrants | Malaysia | 100.0 /100 | #58 | Exceptional 8.2% |
| Immigrants | Philippines | 100.0 /100 | #59 | Exceptional 8.2% |
| Basques | 100.0 /100 | #60 | Exceptional 8.2% |
| Koreans | 100.0 /100 | #61 | Exceptional 8.2% |
| Spanish American Indians | 100.0 /100 | #62 | Exceptional 8.2% |
| Immigrants | South Eastern Asia | 99.9 /100 | #63 | Exceptional 8.2% |
| Immigrants | Kuwait | 99.9 /100 | #64 | Exceptional 8.3% |