Immigrants from Philippines vs Ghanaian Male Unemployment
COMPARE
Immigrants from Philippines
Ghanaian
Male Unemployment
Male Unemployment Comparison
Immigrants from Philippines
Ghanaians
5.4%
MALE UNEMPLOYMENT
13.5/ 100
METRIC RATING
201st/ 347
METRIC RANK
6.1%
MALE UNEMPLOYMENT
0.0/ 100
METRIC RATING
279th/ 347
METRIC RANK
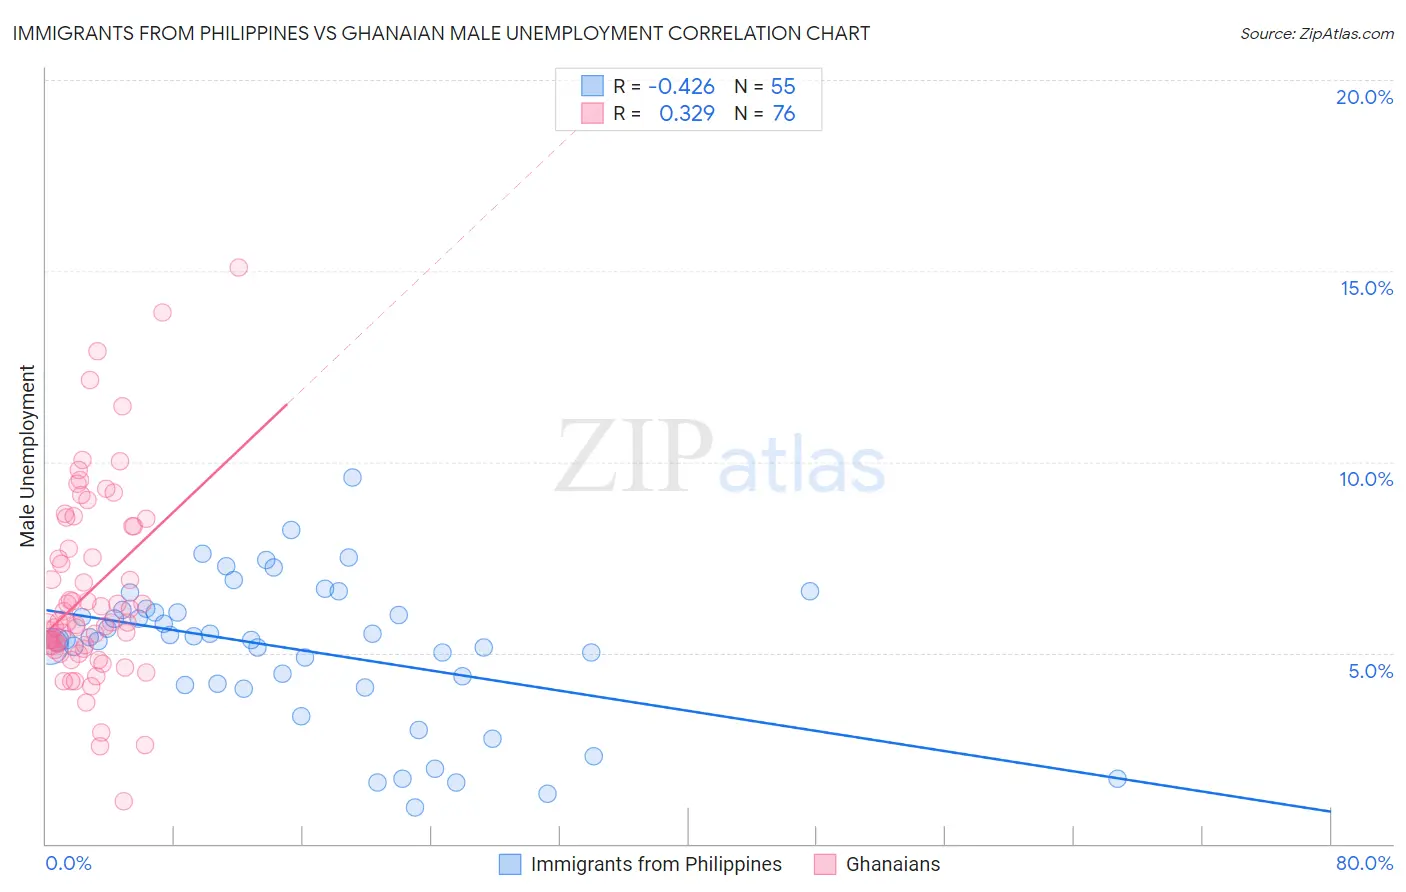
Immigrants from Philippines vs Ghanaian Male Unemployment Correlation Chart
The statistical analysis conducted on geographies consisting of 468,596,641 people shows a moderate negative correlation between the proportion of Immigrants from Philippines and unemployment rate among males in the United States with a correlation coefficient (R) of -0.426 and weighted average of 5.4%. Similarly, the statistical analysis conducted on geographies consisting of 190,397,000 people shows a mild positive correlation between the proportion of Ghanaians and unemployment rate among males in the United States with a correlation coefficient (R) of 0.329 and weighted average of 6.1%, a difference of 12.0%.
Male Unemployment Correlation Summary
| Measurement | Immigrants from Philippines | Ghanaian |
| Minimum | 0.95% | 1.1% |
| Maximum | 9.6% | 15.1% |
| Range | 8.6% | 14.0% |
| Mean | 5.1% | 6.6% |
| Median | 5.3% | 5.8% |
| Interquartile 25% (IQ1) | 4.2% | 5.1% |
| Interquartile 75% (IQ3) | 6.1% | 8.3% |
| Interquartile Range (IQR) | 1.9% | 3.2% |
| Standard Deviation (Sample) | 1.9% | 2.6% |
| Standard Deviation (Population) | 1.9% | 2.5% |
Similar Demographics by Male Unemployment
Demographics Similar to Immigrants from Philippines by Male Unemployment
In terms of male unemployment, the demographic groups most similar to Immigrants from Philippines are Immigrants from Zaire (5.4%, a difference of 0.020%), Nonimmigrants (5.4%, a difference of 0.040%), Immigrants from Laos (5.4%, a difference of 0.050%), Immigrants from Greece (5.4%, a difference of 0.12%), and Immigrants from Thailand (5.4%, a difference of 0.15%).
| Demographics | Rating | Rank | Male Unemployment |
| Spanish | 19.7 /100 | #194 | Poor 5.4% |
| Immigrants | Southern Europe | 17.7 /100 | #195 | Poor 5.4% |
| Albanians | 17.3 /100 | #196 | Poor 5.4% |
| Alsatians | 16.7 /100 | #197 | Poor 5.4% |
| Immigrants | Thailand | 14.7 /100 | #198 | Poor 5.4% |
| Immigrants | Greece | 14.5 /100 | #199 | Poor 5.4% |
| Immigrants | Zaire | 13.7 /100 | #200 | Poor 5.4% |
| Immigrants | Philippines | 13.5 /100 | #201 | Poor 5.4% |
| Immigrants | Nonimmigrants | 13.1 /100 | #202 | Poor 5.4% |
| Immigrants | Laos | 13.0 /100 | #203 | Poor 5.4% |
| Guamanians/Chamorros | 12.3 /100 | #204 | Poor 5.4% |
| Immigrants | Costa Rica | 11.4 /100 | #205 | Poor 5.5% |
| Immigrants | Ukraine | 9.9 /100 | #206 | Tragic 5.5% |
| Immigrants | Syria | 9.3 /100 | #207 | Tragic 5.5% |
| Immigrants | Lebanon | 8.6 /100 | #208 | Tragic 5.5% |
Demographics Similar to Ghanaians by Male Unemployment
In terms of male unemployment, the demographic groups most similar to Ghanaians are Immigrants from Fiji (6.1%, a difference of 0.50%), Immigrants from Liberia (6.1%, a difference of 0.62%), Immigrants from Ghana (6.2%, a difference of 0.99%), Tlingit-Haida (6.0%, a difference of 1.1%), and Sierra Leonean (6.2%, a difference of 1.1%).
| Demographics | Rating | Rank | Male Unemployment |
| Immigrants | Uzbekistan | 0.0 /100 | #272 | Tragic 6.0% |
| Armenians | 0.0 /100 | #273 | Tragic 6.0% |
| Immigrants | Sierra Leone | 0.0 /100 | #274 | Tragic 6.0% |
| Menominee | 0.0 /100 | #275 | Tragic 6.0% |
| Tlingit-Haida | 0.0 /100 | #276 | Tragic 6.0% |
| Immigrants | Liberia | 0.0 /100 | #277 | Tragic 6.1% |
| Immigrants | Fiji | 0.0 /100 | #278 | Tragic 6.1% |
| Ghanaians | 0.0 /100 | #279 | Tragic 6.1% |
| Immigrants | Ghana | 0.0 /100 | #280 | Tragic 6.2% |
| Sierra Leoneans | 0.0 /100 | #281 | Tragic 6.2% |
| Ecuadorians | 0.0 /100 | #282 | Tragic 6.2% |
| Immigrants | Western Africa | 0.0 /100 | #283 | Tragic 6.2% |
| Spanish American Indians | 0.0 /100 | #284 | Tragic 6.2% |
| Immigrants | Ecuador | 0.0 /100 | #285 | Tragic 6.2% |
| Africans | 0.0 /100 | #286 | Tragic 6.3% |