Immigrants from Latin America vs Ghanaian Male Unemployment
COMPARE
Immigrants from Latin America
Ghanaian
Male Unemployment
Male Unemployment Comparison
Immigrants from Latin America
Ghanaians
5.9%
MALE UNEMPLOYMENT
0.1/ 100
METRIC RATING
263rd/ 347
METRIC RANK
6.1%
MALE UNEMPLOYMENT
0.0/ 100
METRIC RATING
279th/ 347
METRIC RANK
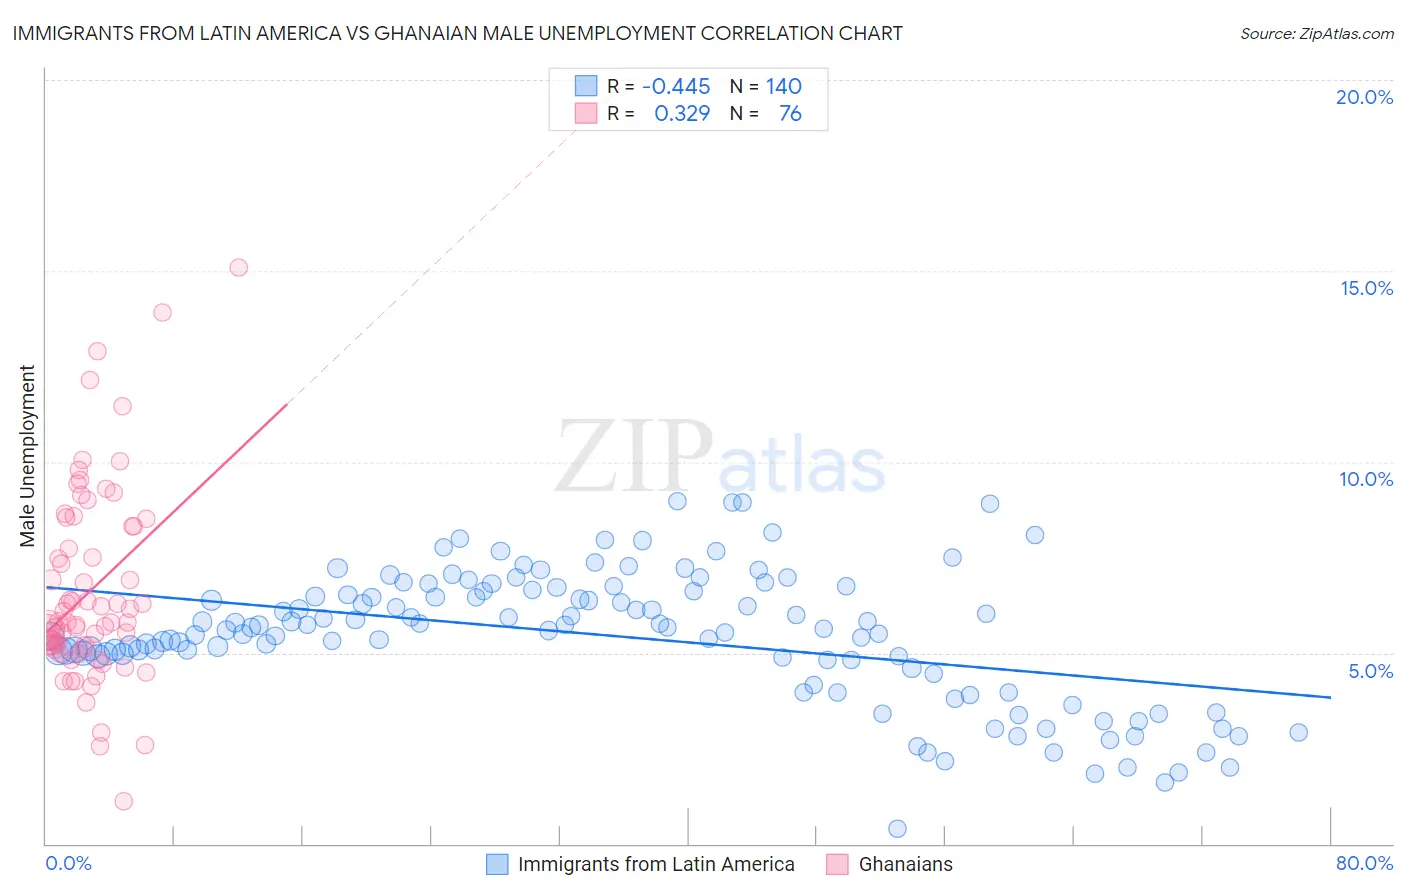
Immigrants from Latin America vs Ghanaian Male Unemployment Correlation Chart
The statistical analysis conducted on geographies consisting of 550,432,007 people shows a moderate negative correlation between the proportion of Immigrants from Latin America and unemployment rate among males in the United States with a correlation coefficient (R) of -0.445 and weighted average of 5.9%. Similarly, the statistical analysis conducted on geographies consisting of 190,397,000 people shows a mild positive correlation between the proportion of Ghanaians and unemployment rate among males in the United States with a correlation coefficient (R) of 0.329 and weighted average of 6.1%, a difference of 3.7%.
Male Unemployment Correlation Summary
| Measurement | Immigrants from Latin America | Ghanaian |
| Minimum | 0.40% | 1.1% |
| Maximum | 9.0% | 15.1% |
| Range | 8.6% | 14.0% |
| Mean | 5.4% | 6.6% |
| Median | 5.6% | 5.8% |
| Interquartile 25% (IQ1) | 4.8% | 5.1% |
| Interquartile 75% (IQ3) | 6.6% | 8.3% |
| Interquartile Range (IQR) | 1.8% | 3.2% |
| Standard Deviation (Sample) | 1.7% | 2.6% |
| Standard Deviation (Population) | 1.7% | 2.5% |
Demographics Similar to Immigrants from Latin America and Ghanaians by Male Unemployment
In terms of male unemployment, the demographic groups most similar to Immigrants from Latin America are Immigrants from Mexico (5.9%, a difference of 0.22%), Immigrants from Portugal (5.9%, a difference of 0.24%), French American Indian (5.9%, a difference of 0.61%), Liberian (5.8%, a difference of 0.69%), and Bahamian (5.9%, a difference of 0.75%). Similarly, the demographic groups most similar to Ghanaians are Immigrants from Fiji (6.1%, a difference of 0.50%), Immigrants from Liberia (6.1%, a difference of 0.62%), Immigrants from Ghana (6.2%, a difference of 0.99%), Tlingit-Haida (6.0%, a difference of 1.1%), and Sierra Leonean (6.2%, a difference of 1.1%).
| Demographics | Rating | Rank | Male Unemployment |
| Liberians | 0.1 /100 | #261 | Tragic 5.8% |
| Immigrants | Portugal | 0.1 /100 | #262 | Tragic 5.9% |
| Immigrants | Latin America | 0.1 /100 | #263 | Tragic 5.9% |
| Immigrants | Mexico | 0.0 /100 | #264 | Tragic 5.9% |
| French American Indians | 0.0 /100 | #265 | Tragic 5.9% |
| Bahamians | 0.0 /100 | #266 | Tragic 5.9% |
| Nigerians | 0.0 /100 | #267 | Tragic 5.9% |
| Bermudans | 0.0 /100 | #268 | Tragic 5.9% |
| Immigrants | Nigeria | 0.0 /100 | #269 | Tragic 6.0% |
| Sub-Saharan Africans | 0.0 /100 | #270 | Tragic 6.0% |
| Blackfeet | 0.0 /100 | #271 | Tragic 6.0% |
| Immigrants | Uzbekistan | 0.0 /100 | #272 | Tragic 6.0% |
| Armenians | 0.0 /100 | #273 | Tragic 6.0% |
| Immigrants | Sierra Leone | 0.0 /100 | #274 | Tragic 6.0% |
| Menominee | 0.0 /100 | #275 | Tragic 6.0% |
| Tlingit-Haida | 0.0 /100 | #276 | Tragic 6.0% |
| Immigrants | Liberia | 0.0 /100 | #277 | Tragic 6.1% |
| Immigrants | Fiji | 0.0 /100 | #278 | Tragic 6.1% |
| Ghanaians | 0.0 /100 | #279 | Tragic 6.1% |
| Immigrants | Ghana | 0.0 /100 | #280 | Tragic 6.2% |
| Sierra Leoneans | 0.0 /100 | #281 | Tragic 6.2% |