Kiowa vs Ghanaian Male Unemployment
COMPARE
Kiowa
Ghanaian
Male Unemployment
Male Unemployment Comparison
Kiowa
Ghanaians
5.8%
MALE UNEMPLOYMENT
0.2/ 100
METRIC RATING
255th/ 347
METRIC RANK
6.1%
MALE UNEMPLOYMENT
0.0/ 100
METRIC RATING
279th/ 347
METRIC RANK
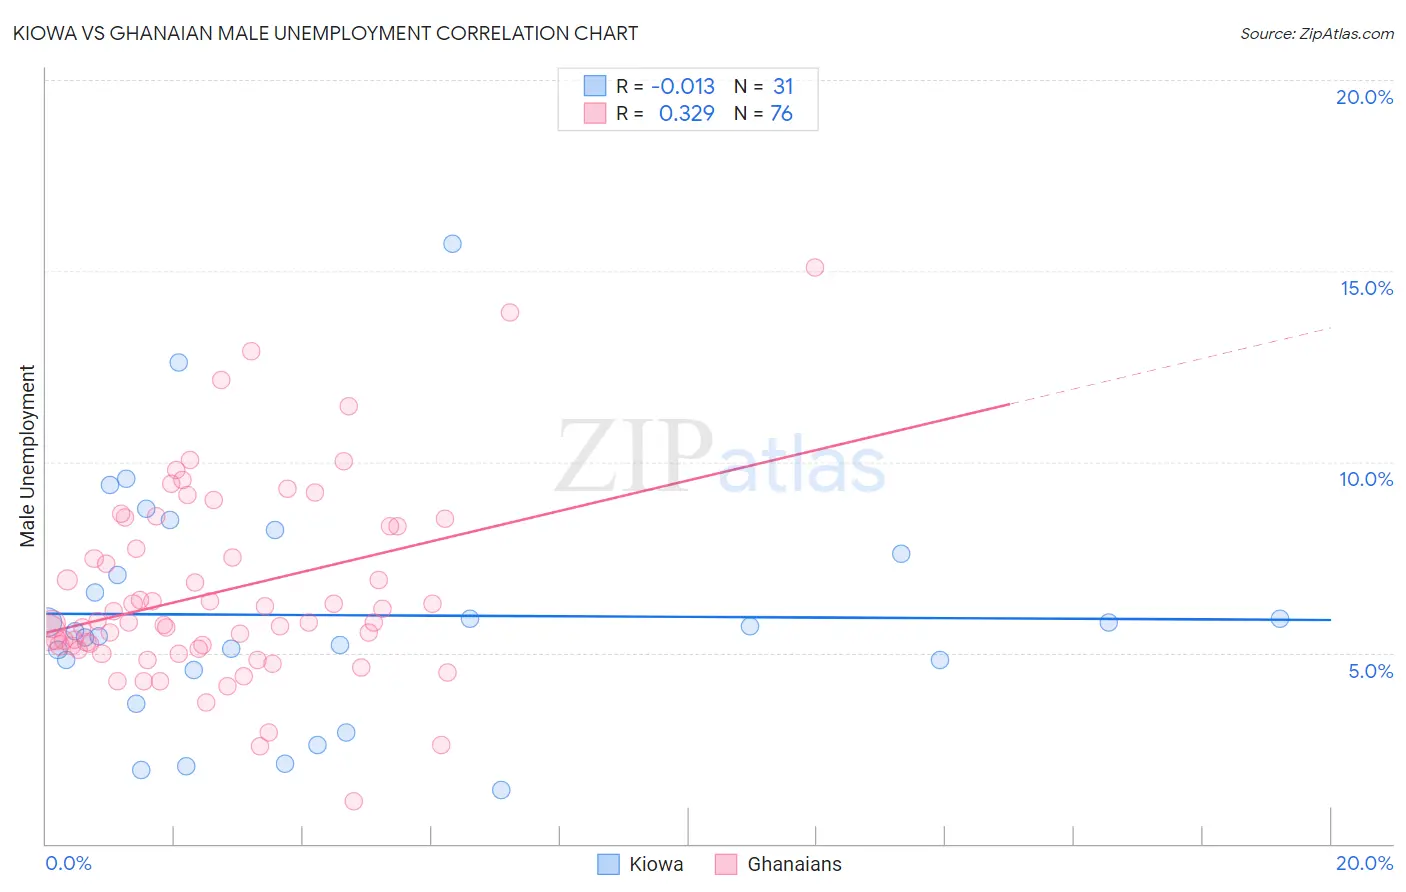
Kiowa vs Ghanaian Male Unemployment Correlation Chart
The statistical analysis conducted on geographies consisting of 56,015,604 people shows no correlation between the proportion of Kiowa and unemployment rate among males in the United States with a correlation coefficient (R) of -0.013 and weighted average of 5.8%. Similarly, the statistical analysis conducted on geographies consisting of 190,397,000 people shows a mild positive correlation between the proportion of Ghanaians and unemployment rate among males in the United States with a correlation coefficient (R) of 0.329 and weighted average of 6.1%, a difference of 5.3%.
Male Unemployment Correlation Summary
| Measurement | Kiowa | Ghanaian |
| Minimum | 1.4% | 1.1% |
| Maximum | 15.7% | 15.1% |
| Range | 14.3% | 14.0% |
| Mean | 6.0% | 6.6% |
| Median | 5.6% | 5.8% |
| Interquartile 25% (IQ1) | 4.5% | 5.1% |
| Interquartile 75% (IQ3) | 7.6% | 8.3% |
| Interquartile Range (IQR) | 3.1% | 3.2% |
| Standard Deviation (Sample) | 3.1% | 2.6% |
| Standard Deviation (Population) | 3.0% | 2.5% |
Similar Demographics by Male Unemployment
Demographics Similar to Kiowa by Male Unemployment
In terms of male unemployment, the demographic groups most similar to Kiowa are Comanche (5.8%, a difference of 0.080%), Japanese (5.8%, a difference of 0.10%), Hispanic or Latino (5.8%, a difference of 0.25%), Mexican American Indian (5.8%, a difference of 0.28%), and Dutch West Indian (5.8%, a difference of 0.38%).
| Demographics | Rating | Rank | Male Unemployment |
| Marshallese | 0.5 /100 | #248 | Tragic 5.7% |
| Cree | 0.4 /100 | #249 | Tragic 5.7% |
| Immigrants | Bahamas | 0.4 /100 | #250 | Tragic 5.7% |
| Spanish Americans | 0.3 /100 | #251 | Tragic 5.7% |
| Mexicans | 0.2 /100 | #252 | Tragic 5.8% |
| Mexican American Indians | 0.2 /100 | #253 | Tragic 5.8% |
| Japanese | 0.2 /100 | #254 | Tragic 5.8% |
| Kiowa | 0.2 /100 | #255 | Tragic 5.8% |
| Comanche | 0.2 /100 | #256 | Tragic 5.8% |
| Hispanics or Latinos | 0.1 /100 | #257 | Tragic 5.8% |
| Dutch West Indians | 0.1 /100 | #258 | Tragic 5.8% |
| Cajuns | 0.1 /100 | #259 | Tragic 5.8% |
| Immigrants | Central America | 0.1 /100 | #260 | Tragic 5.8% |
| Liberians | 0.1 /100 | #261 | Tragic 5.8% |
| Immigrants | Portugal | 0.1 /100 | #262 | Tragic 5.9% |
Demographics Similar to Ghanaians by Male Unemployment
In terms of male unemployment, the demographic groups most similar to Ghanaians are Immigrants from Fiji (6.1%, a difference of 0.50%), Immigrants from Liberia (6.1%, a difference of 0.62%), Immigrants from Ghana (6.2%, a difference of 0.99%), Tlingit-Haida (6.0%, a difference of 1.1%), and Sierra Leonean (6.2%, a difference of 1.1%).
| Demographics | Rating | Rank | Male Unemployment |
| Immigrants | Uzbekistan | 0.0 /100 | #272 | Tragic 6.0% |
| Armenians | 0.0 /100 | #273 | Tragic 6.0% |
| Immigrants | Sierra Leone | 0.0 /100 | #274 | Tragic 6.0% |
| Menominee | 0.0 /100 | #275 | Tragic 6.0% |
| Tlingit-Haida | 0.0 /100 | #276 | Tragic 6.0% |
| Immigrants | Liberia | 0.0 /100 | #277 | Tragic 6.1% |
| Immigrants | Fiji | 0.0 /100 | #278 | Tragic 6.1% |
| Ghanaians | 0.0 /100 | #279 | Tragic 6.1% |
| Immigrants | Ghana | 0.0 /100 | #280 | Tragic 6.2% |
| Sierra Leoneans | 0.0 /100 | #281 | Tragic 6.2% |
| Ecuadorians | 0.0 /100 | #282 | Tragic 6.2% |
| Immigrants | Western Africa | 0.0 /100 | #283 | Tragic 6.2% |
| Spanish American Indians | 0.0 /100 | #284 | Tragic 6.2% |
| Immigrants | Ecuador | 0.0 /100 | #285 | Tragic 6.2% |
| Africans | 0.0 /100 | #286 | Tragic 6.3% |