Colville vs Ghanaian Male Unemployment
COMPARE
Colville
Ghanaian
Male Unemployment
Male Unemployment Comparison
Colville
Ghanaians
7.4%
MALE UNEMPLOYMENT
0.0/ 100
METRIC RATING
320th/ 347
METRIC RANK
6.1%
MALE UNEMPLOYMENT
0.0/ 100
METRIC RATING
279th/ 347
METRIC RANK
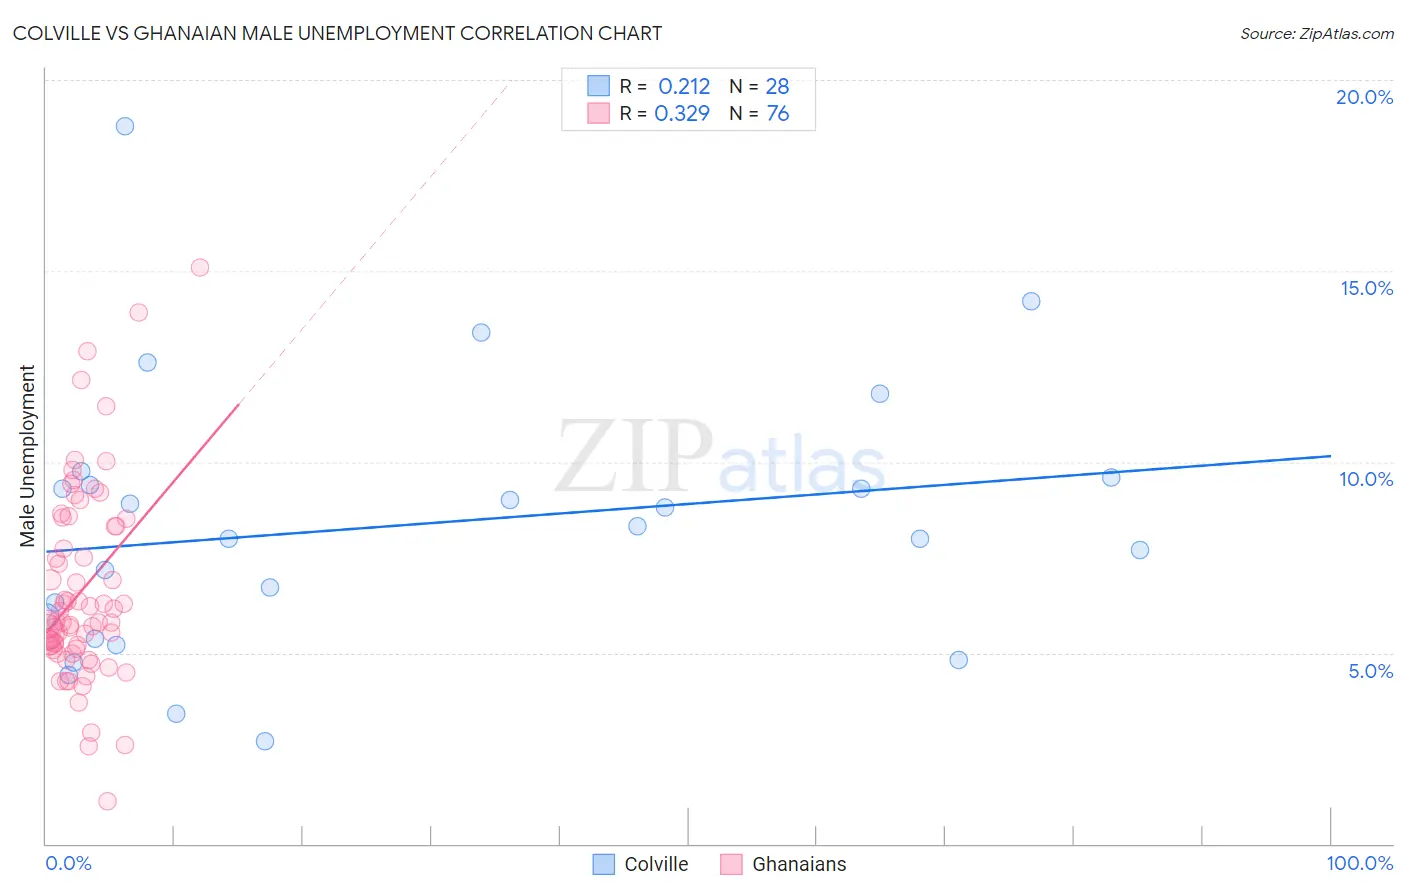
Colville vs Ghanaian Male Unemployment Correlation Chart
The statistical analysis conducted on geographies consisting of 34,671,392 people shows a weak positive correlation between the proportion of Colville and unemployment rate among males in the United States with a correlation coefficient (R) of 0.212 and weighted average of 7.4%. Similarly, the statistical analysis conducted on geographies consisting of 190,397,000 people shows a mild positive correlation between the proportion of Ghanaians and unemployment rate among males in the United States with a correlation coefficient (R) of 0.329 and weighted average of 6.1%, a difference of 20.9%.
Male Unemployment Correlation Summary
| Measurement | Colville | Ghanaian |
| Minimum | 2.7% | 1.1% |
| Maximum | 18.8% | 15.1% |
| Range | 16.1% | 14.0% |
| Mean | 8.3% | 6.6% |
| Median | 8.2% | 5.8% |
| Interquartile 25% (IQ1) | 5.7% | 5.1% |
| Interquartile 75% (IQ3) | 9.5% | 8.3% |
| Interquartile Range (IQR) | 3.8% | 3.2% |
| Standard Deviation (Sample) | 3.5% | 2.6% |
| Standard Deviation (Population) | 3.5% | 2.5% |
Similar Demographics by Male Unemployment
Demographics Similar to Colville by Male Unemployment
In terms of male unemployment, the demographic groups most similar to Colville are British West Indian (7.3%, a difference of 0.90%), Immigrants from St. Vincent and the Grenadines (7.5%, a difference of 1.4%), Immigrants from Cabo Verde (7.5%, a difference of 1.7%), Immigrants from Grenada (7.6%, a difference of 2.5%), and Dominican (7.6%, a difference of 2.8%).
| Demographics | Rating | Rank | Male Unemployment |
| Immigrants | Dominica | 0.0 /100 | #313 | Tragic 7.0% |
| Immigrants | Barbados | 0.0 /100 | #314 | Tragic 7.1% |
| Houma | 0.0 /100 | #315 | Tragic 7.1% |
| Immigrants | Guyana | 0.0 /100 | #316 | Tragic 7.1% |
| Guyanese | 0.0 /100 | #317 | Tragic 7.1% |
| Cape Verdeans | 0.0 /100 | #318 | Tragic 7.1% |
| British West Indians | 0.0 /100 | #319 | Tragic 7.3% |
| Colville | 0.0 /100 | #320 | Tragic 7.4% |
| Immigrants | St. Vincent and the Grenadines | 0.0 /100 | #321 | Tragic 7.5% |
| Immigrants | Cabo Verde | 0.0 /100 | #322 | Tragic 7.5% |
| Immigrants | Grenada | 0.0 /100 | #323 | Tragic 7.6% |
| Dominicans | 0.0 /100 | #324 | Tragic 7.6% |
| Shoshone | 0.0 /100 | #325 | Tragic 7.6% |
| Immigrants | Dominican Republic | 0.0 /100 | #326 | Tragic 7.6% |
| Paiute | 0.0 /100 | #327 | Tragic 7.7% |
Demographics Similar to Ghanaians by Male Unemployment
In terms of male unemployment, the demographic groups most similar to Ghanaians are Immigrants from Fiji (6.1%, a difference of 0.50%), Immigrants from Liberia (6.1%, a difference of 0.62%), Immigrants from Ghana (6.2%, a difference of 0.99%), Tlingit-Haida (6.0%, a difference of 1.1%), and Sierra Leonean (6.2%, a difference of 1.1%).
| Demographics | Rating | Rank | Male Unemployment |
| Immigrants | Uzbekistan | 0.0 /100 | #272 | Tragic 6.0% |
| Armenians | 0.0 /100 | #273 | Tragic 6.0% |
| Immigrants | Sierra Leone | 0.0 /100 | #274 | Tragic 6.0% |
| Menominee | 0.0 /100 | #275 | Tragic 6.0% |
| Tlingit-Haida | 0.0 /100 | #276 | Tragic 6.0% |
| Immigrants | Liberia | 0.0 /100 | #277 | Tragic 6.1% |
| Immigrants | Fiji | 0.0 /100 | #278 | Tragic 6.1% |
| Ghanaians | 0.0 /100 | #279 | Tragic 6.1% |
| Immigrants | Ghana | 0.0 /100 | #280 | Tragic 6.2% |
| Sierra Leoneans | 0.0 /100 | #281 | Tragic 6.2% |
| Ecuadorians | 0.0 /100 | #282 | Tragic 6.2% |
| Immigrants | Western Africa | 0.0 /100 | #283 | Tragic 6.2% |
| Spanish American Indians | 0.0 /100 | #284 | Tragic 6.2% |
| Immigrants | Ecuador | 0.0 /100 | #285 | Tragic 6.2% |
| Africans | 0.0 /100 | #286 | Tragic 6.3% |