Immigrants from Chile vs Houma Unemployment
COMPARE
Immigrants from Chile
Houma
Unemployment
Unemployment Comparison
Immigrants from Chile
Houma
5.1%
UNEMPLOYMENT
82.8/ 100
METRIC RATING
143rd/ 347
METRIC RANK
6.7%
UNEMPLOYMENT
0.0/ 100
METRIC RATING
315th/ 347
METRIC RANK
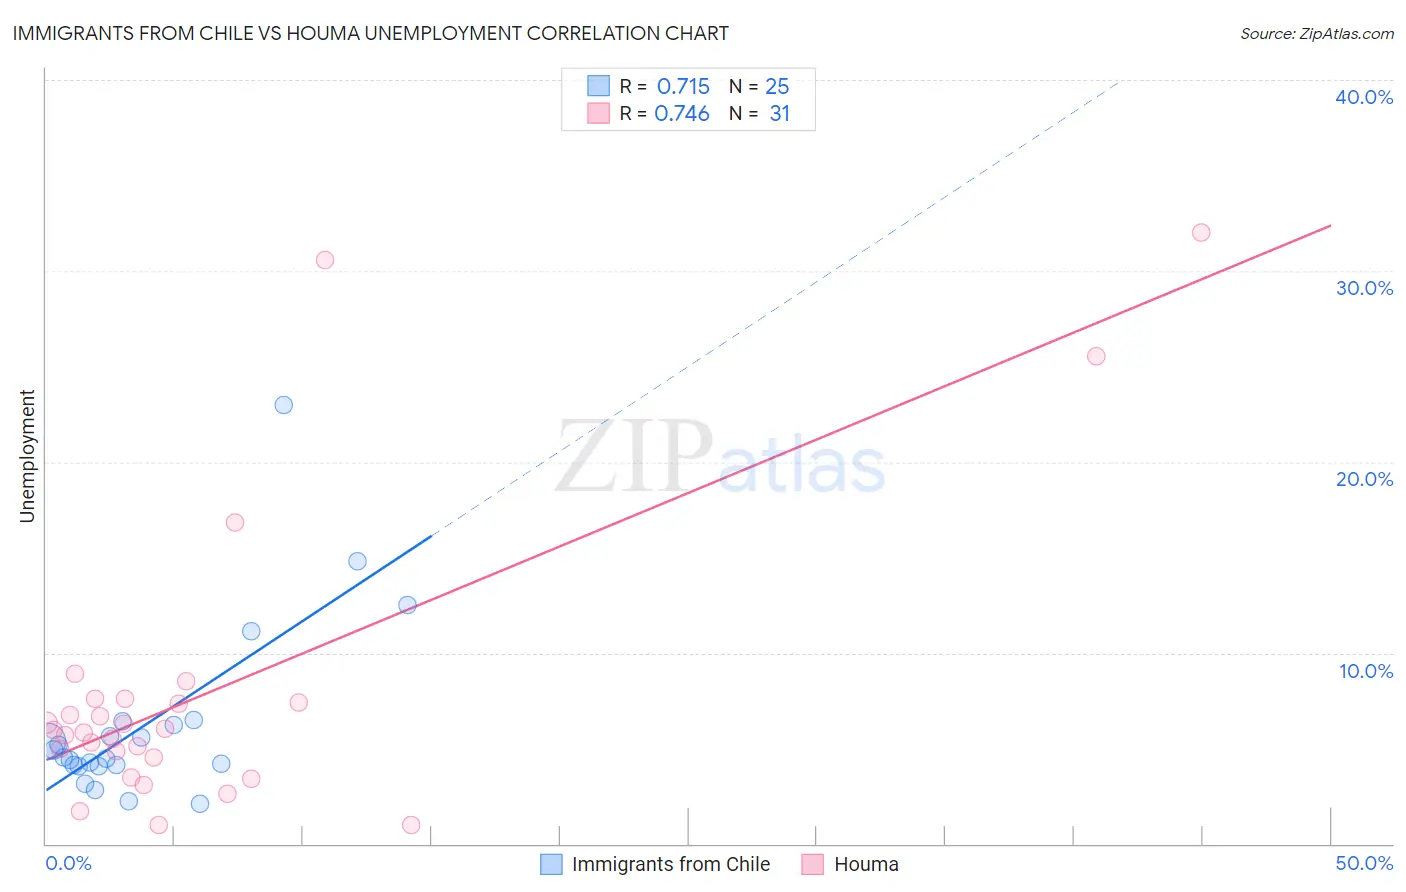
Immigrants from Chile vs Houma Unemployment Correlation Chart
The statistical analysis conducted on geographies consisting of 218,562,271 people shows a strong positive correlation between the proportion of Immigrants from Chile and unemployment in the United States with a correlation coefficient (R) of 0.715 and weighted average of 5.1%. Similarly, the statistical analysis conducted on geographies consisting of 36,775,803 people shows a strong positive correlation between the proportion of Houma and unemployment in the United States with a correlation coefficient (R) of 0.746 and weighted average of 6.7%, a difference of 30.3%.
Unemployment Correlation Summary
| Measurement | Immigrants from Chile | Houma |
| Minimum | 2.1% | 1.0% |
| Maximum | 23.0% | 32.0% |
| Range | 20.9% | 31.0% |
| Mean | 6.2% | 8.0% |
| Median | 4.5% | 6.0% |
| Interquartile 25% (IQ1) | 4.1% | 4.5% |
| Interquartile 75% (IQ3) | 6.3% | 7.6% |
| Interquartile Range (IQR) | 2.2% | 3.1% |
| Standard Deviation (Sample) | 4.6% | 7.7% |
| Standard Deviation (Population) | 4.5% | 7.6% |
Similar Demographics by Unemployment
Demographics Similar to Immigrants from Chile by Unemployment
In terms of unemployment, the demographic groups most similar to Immigrants from Chile are Immigrants from Pakistan (5.1%, a difference of 0.050%), Indonesian (5.1%, a difference of 0.050%), Palestinian (5.1%, a difference of 0.070%), Immigrants from Norway (5.1%, a difference of 0.11%), and Immigrants from Asia (5.1%, a difference of 0.11%).
| Demographics | Rating | Rank | Unemployment |
| Immigrants | Spain | 86.2 /100 | #136 | Excellent 5.1% |
| Immigrants | Saudi Arabia | 85.6 /100 | #137 | Excellent 5.1% |
| Immigrants | Hungary | 85.6 /100 | #138 | Excellent 5.1% |
| Pakistanis | 85.3 /100 | #139 | Excellent 5.1% |
| Immigrants | Denmark | 84.3 /100 | #140 | Excellent 5.1% |
| Palestinians | 83.4 /100 | #141 | Excellent 5.1% |
| Immigrants | Pakistan | 83.2 /100 | #142 | Excellent 5.1% |
| Immigrants | Chile | 82.8 /100 | #143 | Excellent 5.1% |
| Indonesians | 82.3 /100 | #144 | Excellent 5.1% |
| Immigrants | Norway | 81.8 /100 | #145 | Excellent 5.1% |
| Immigrants | Asia | 81.8 /100 | #146 | Excellent 5.1% |
| Indians (Asian) | 81.6 /100 | #147 | Excellent 5.1% |
| Immigrants | Italy | 79.1 /100 | #148 | Good 5.1% |
| Syrians | 77.7 /100 | #149 | Good 5.2% |
| Potawatomi | 76.2 /100 | #150 | Good 5.2% |
Demographics Similar to Houma by Unemployment
In terms of unemployment, the demographic groups most similar to Houma are Black/African American (6.6%, a difference of 0.80%), Immigrants from Dominica (6.7%, a difference of 0.83%), Immigrants from Barbados (6.6%, a difference of 1.3%), Shoshone (6.8%, a difference of 1.4%), and Colville (6.6%, a difference of 1.7%).
| Demographics | Rating | Rank | Unemployment |
| Barbadians | 0.0 /100 | #308 | Tragic 6.5% |
| Vietnamese | 0.0 /100 | #309 | Tragic 6.5% |
| Immigrants | Belize | 0.0 /100 | #310 | Tragic 6.5% |
| Cape Verdeans | 0.0 /100 | #311 | Tragic 6.5% |
| Colville | 0.0 /100 | #312 | Tragic 6.6% |
| Immigrants | Barbados | 0.0 /100 | #313 | Tragic 6.6% |
| Blacks/African Americans | 0.0 /100 | #314 | Tragic 6.6% |
| Houma | 0.0 /100 | #315 | Tragic 6.7% |
| Immigrants | Dominica | 0.0 /100 | #316 | Tragic 6.7% |
| Shoshone | 0.0 /100 | #317 | Tragic 6.8% |
| Immigrants | Cabo Verde | 0.0 /100 | #318 | Tragic 6.8% |
| British West Indians | 0.0 /100 | #319 | Tragic 6.8% |
| Immigrants | St. Vincent and the Grenadines | 0.0 /100 | #320 | Tragic 6.9% |
| Immigrants | Guyana | 0.0 /100 | #321 | Tragic 6.9% |
| Guyanese | 0.0 /100 | #322 | Tragic 6.9% |