Immigrants from Ethiopia vs Houma Unemployment
COMPARE
Immigrants from Ethiopia
Houma
Unemployment
Unemployment Comparison
Immigrants from Ethiopia
Houma
5.1%
UNEMPLOYMENT
86.7/ 100
METRIC RATING
132nd/ 347
METRIC RANK
6.7%
UNEMPLOYMENT
0.0/ 100
METRIC RATING
315th/ 347
METRIC RANK
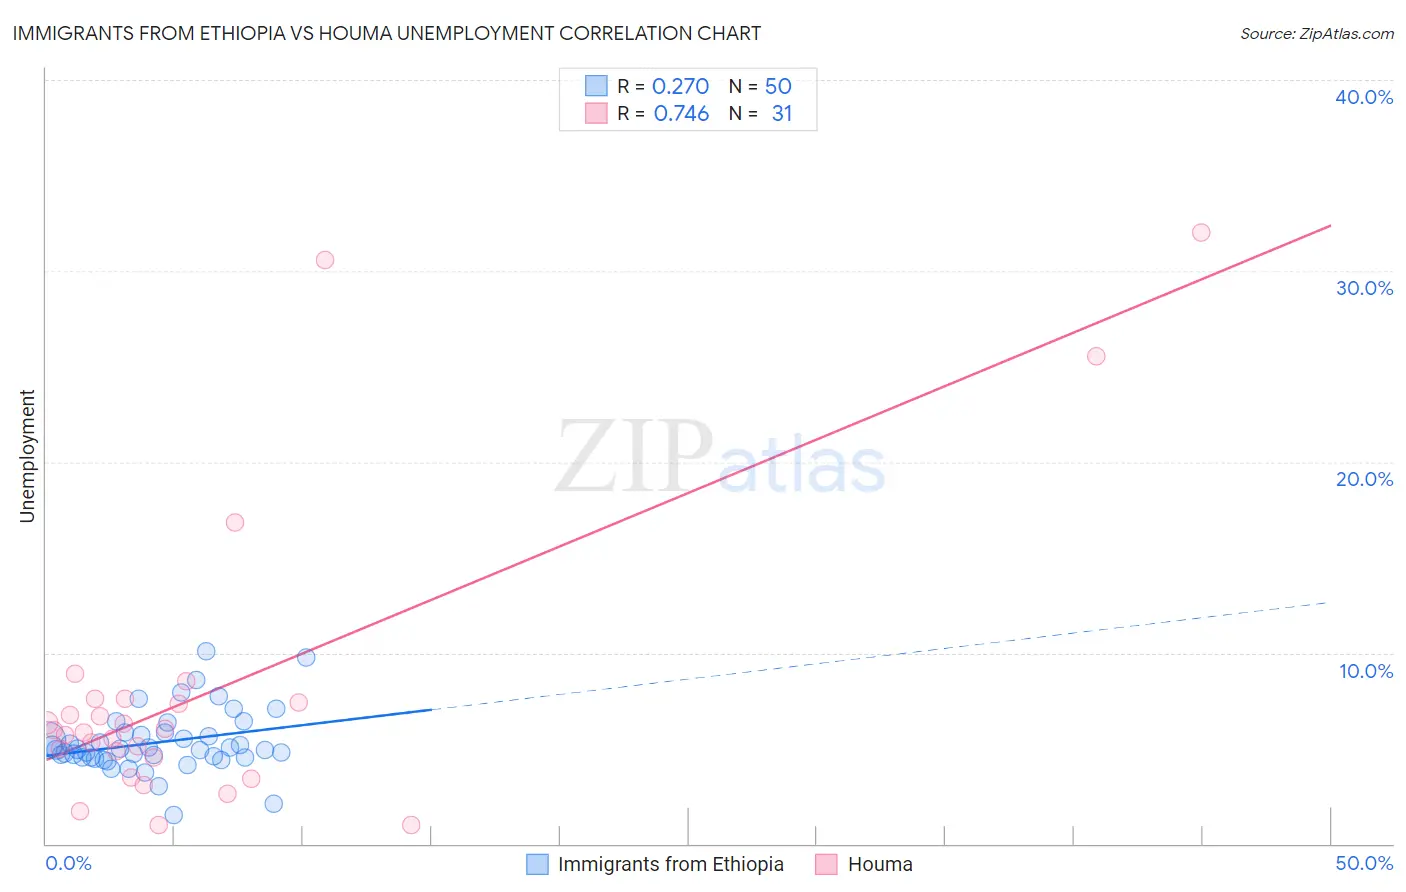
Immigrants from Ethiopia vs Houma Unemployment Correlation Chart
The statistical analysis conducted on geographies consisting of 211,490,952 people shows a weak positive correlation between the proportion of Immigrants from Ethiopia and unemployment in the United States with a correlation coefficient (R) of 0.270 and weighted average of 5.1%. Similarly, the statistical analysis conducted on geographies consisting of 36,775,803 people shows a strong positive correlation between the proportion of Houma and unemployment in the United States with a correlation coefficient (R) of 0.746 and weighted average of 6.7%, a difference of 30.9%.
Unemployment Correlation Summary
| Measurement | Immigrants from Ethiopia | Houma |
| Minimum | 1.5% | 1.0% |
| Maximum | 10.1% | 32.0% |
| Range | 8.6% | 31.0% |
| Mean | 5.3% | 8.0% |
| Median | 4.9% | 6.0% |
| Interquartile 25% (IQ1) | 4.5% | 4.5% |
| Interquartile 75% (IQ3) | 5.8% | 7.6% |
| Interquartile Range (IQR) | 1.3% | 3.1% |
| Standard Deviation (Sample) | 1.6% | 7.7% |
| Standard Deviation (Population) | 1.6% | 7.6% |
Similar Demographics by Unemployment
Demographics Similar to Immigrants from Ethiopia by Unemployment
In terms of unemployment, the demographic groups most similar to Immigrants from Ethiopia are Immigrants from Croatia (5.1%, a difference of 0.010%), Immigrants from Jordan (5.1%, a difference of 0.010%), Iranian (5.1%, a difference of 0.030%), Immigrants from Europe (5.1%, a difference of 0.050%), and Immigrants from Burma/Myanmar (5.1%, a difference of 0.060%).
| Demographics | Rating | Rank | Unemployment |
| Immigrants | Eastern Asia | 88.3 /100 | #125 | Excellent 5.1% |
| Kenyans | 88.2 /100 | #126 | Excellent 5.1% |
| Immigrants | Kenya | 88.2 /100 | #127 | Excellent 5.1% |
| Immigrants | Eastern Africa | 88.1 /100 | #128 | Excellent 5.1% |
| Immigrants | Latvia | 88.0 /100 | #129 | Excellent 5.1% |
| Iranians | 86.9 /100 | #130 | Excellent 5.1% |
| Immigrants | Croatia | 86.8 /100 | #131 | Excellent 5.1% |
| Immigrants | Ethiopia | 86.7 /100 | #132 | Excellent 5.1% |
| Immigrants | Jordan | 86.6 /100 | #133 | Excellent 5.1% |
| Immigrants | Europe | 86.3 /100 | #134 | Excellent 5.1% |
| Immigrants | Burma/Myanmar | 86.2 /100 | #135 | Excellent 5.1% |
| Immigrants | Spain | 86.2 /100 | #136 | Excellent 5.1% |
| Immigrants | Saudi Arabia | 85.6 /100 | #137 | Excellent 5.1% |
| Immigrants | Hungary | 85.6 /100 | #138 | Excellent 5.1% |
| Pakistanis | 85.3 /100 | #139 | Excellent 5.1% |
Demographics Similar to Houma by Unemployment
In terms of unemployment, the demographic groups most similar to Houma are Black/African American (6.6%, a difference of 0.80%), Immigrants from Dominica (6.7%, a difference of 0.83%), Immigrants from Barbados (6.6%, a difference of 1.3%), Shoshone (6.8%, a difference of 1.4%), and Colville (6.6%, a difference of 1.7%).
| Demographics | Rating | Rank | Unemployment |
| Barbadians | 0.0 /100 | #308 | Tragic 6.5% |
| Vietnamese | 0.0 /100 | #309 | Tragic 6.5% |
| Immigrants | Belize | 0.0 /100 | #310 | Tragic 6.5% |
| Cape Verdeans | 0.0 /100 | #311 | Tragic 6.5% |
| Colville | 0.0 /100 | #312 | Tragic 6.6% |
| Immigrants | Barbados | 0.0 /100 | #313 | Tragic 6.6% |
| Blacks/African Americans | 0.0 /100 | #314 | Tragic 6.6% |
| Houma | 0.0 /100 | #315 | Tragic 6.7% |
| Immigrants | Dominica | 0.0 /100 | #316 | Tragic 6.7% |
| Shoshone | 0.0 /100 | #317 | Tragic 6.8% |
| Immigrants | Cabo Verde | 0.0 /100 | #318 | Tragic 6.8% |
| British West Indians | 0.0 /100 | #319 | Tragic 6.8% |
| Immigrants | St. Vincent and the Grenadines | 0.0 /100 | #320 | Tragic 6.9% |
| Immigrants | Guyana | 0.0 /100 | #321 | Tragic 6.9% |
| Guyanese | 0.0 /100 | #322 | Tragic 6.9% |