Immigrants from Nigeria vs Uruguayan Male Unemployment
COMPARE
Immigrants from Nigeria
Uruguayan
Male Unemployment
Male Unemployment Comparison
Immigrants from Nigeria
Uruguayans
6.0%
MALE UNEMPLOYMENT
0.0/ 100
METRIC RATING
269th/ 347
METRIC RANK
5.1%
MALE UNEMPLOYMENT
93.0/ 100
METRIC RATING
99th/ 347
METRIC RANK
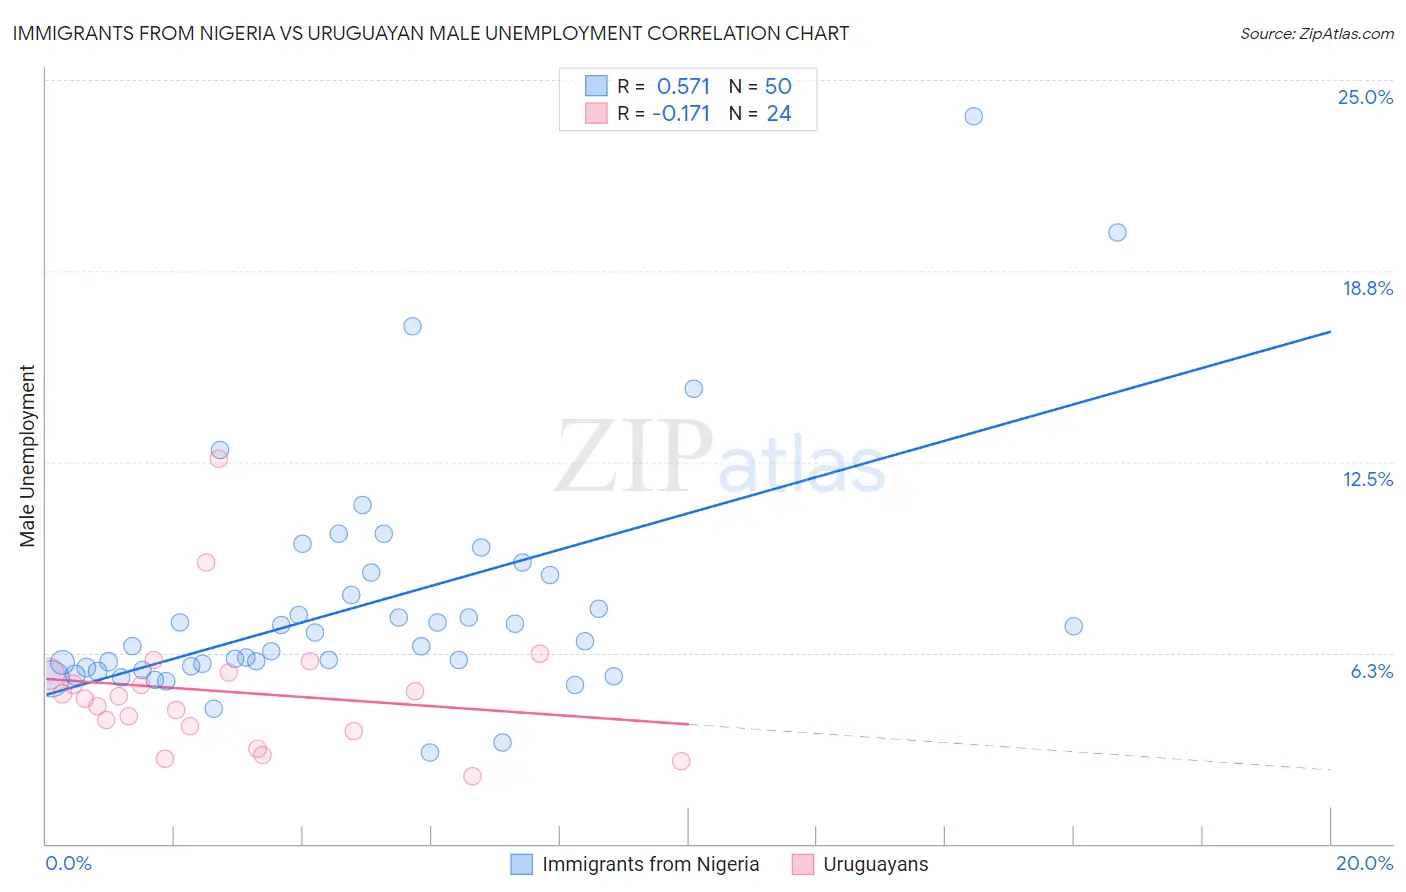
Immigrants from Nigeria vs Uruguayan Male Unemployment Correlation Chart
The statistical analysis conducted on geographies consisting of 282,980,898 people shows a substantial positive correlation between the proportion of Immigrants from Nigeria and unemployment rate among males in the United States with a correlation coefficient (R) of 0.571 and weighted average of 6.0%. Similarly, the statistical analysis conducted on geographies consisting of 144,681,334 people shows a poor negative correlation between the proportion of Uruguayans and unemployment rate among males in the United States with a correlation coefficient (R) of -0.171 and weighted average of 5.1%, a difference of 16.8%.
Male Unemployment Correlation Summary
| Measurement | Immigrants from Nigeria | Uruguayan |
| Minimum | 3.0% | 2.2% |
| Maximum | 23.8% | 12.6% |
| Range | 20.8% | 10.4% |
| Mean | 7.8% | 5.0% |
| Median | 6.6% | 4.8% |
| Interquartile 25% (IQ1) | 5.8% | 3.8% |
| Interquartile 75% (IQ3) | 8.8% | 5.6% |
| Interquartile Range (IQR) | 3.0% | 1.8% |
| Standard Deviation (Sample) | 3.9% | 2.2% |
| Standard Deviation (Population) | 3.9% | 2.2% |
Similar Demographics by Male Unemployment
Demographics Similar to Immigrants from Nigeria by Male Unemployment
In terms of male unemployment, the demographic groups most similar to Immigrants from Nigeria are Subsaharan African (6.0%, a difference of 0.13%), Bermudan (5.9%, a difference of 0.27%), Nigerian (5.9%, a difference of 0.48%), Bahamian (5.9%, a difference of 0.60%), and Blackfeet (6.0%, a difference of 0.64%).
| Demographics | Rating | Rank | Male Unemployment |
| Immigrants | Portugal | 0.1 /100 | #262 | Tragic 5.9% |
| Immigrants | Latin America | 0.1 /100 | #263 | Tragic 5.9% |
| Immigrants | Mexico | 0.0 /100 | #264 | Tragic 5.9% |
| French American Indians | 0.0 /100 | #265 | Tragic 5.9% |
| Bahamians | 0.0 /100 | #266 | Tragic 5.9% |
| Nigerians | 0.0 /100 | #267 | Tragic 5.9% |
| Bermudans | 0.0 /100 | #268 | Tragic 5.9% |
| Immigrants | Nigeria | 0.0 /100 | #269 | Tragic 6.0% |
| Sub-Saharan Africans | 0.0 /100 | #270 | Tragic 6.0% |
| Blackfeet | 0.0 /100 | #271 | Tragic 6.0% |
| Immigrants | Uzbekistan | 0.0 /100 | #272 | Tragic 6.0% |
| Armenians | 0.0 /100 | #273 | Tragic 6.0% |
| Immigrants | Sierra Leone | 0.0 /100 | #274 | Tragic 6.0% |
| Menominee | 0.0 /100 | #275 | Tragic 6.0% |
| Tlingit-Haida | 0.0 /100 | #276 | Tragic 6.0% |
Demographics Similar to Uruguayans by Male Unemployment
In terms of male unemployment, the demographic groups most similar to Uruguayans are Russian (5.1%, a difference of 0.020%), German Russian (5.1%, a difference of 0.060%), Immigrants from Kuwait (5.1%, a difference of 0.070%), Immigrants from France (5.1%, a difference of 0.070%), and Immigrants from Spain (5.1%, a difference of 0.10%).
| Demographics | Rating | Rank | Male Unemployment |
| Slavs | 94.2 /100 | #92 | Exceptional 5.1% |
| Immigrants | Serbia | 94.2 /100 | #93 | Exceptional 5.1% |
| Canadians | 94.1 /100 | #94 | Exceptional 5.1% |
| Italians | 93.8 /100 | #95 | Exceptional 5.1% |
| Asians | 93.7 /100 | #96 | Exceptional 5.1% |
| Immigrants | Spain | 93.4 /100 | #97 | Exceptional 5.1% |
| Immigrants | Kuwait | 93.3 /100 | #98 | Exceptional 5.1% |
| Uruguayans | 93.0 /100 | #99 | Exceptional 5.1% |
| Russians | 92.9 /100 | #100 | Exceptional 5.1% |
| German Russians | 92.7 /100 | #101 | Exceptional 5.1% |
| Immigrants | France | 92.7 /100 | #102 | Exceptional 5.1% |
| Immigrants | Jordan | 91.9 /100 | #103 | Exceptional 5.1% |
| Immigrants | Chile | 91.8 /100 | #104 | Exceptional 5.1% |
| Immigrants | Czechoslovakia | 91.7 /100 | #105 | Exceptional 5.1% |
| Immigrants | Ethiopia | 91.5 /100 | #106 | Exceptional 5.1% |