Immigrants from Nigeria vs Cypriot Male Unemployment
COMPARE
Immigrants from Nigeria
Cypriot
Male Unemployment
Male Unemployment Comparison
Immigrants from Nigeria
Cypriots
6.0%
MALE UNEMPLOYMENT
0.0/ 100
METRIC RATING
269th/ 347
METRIC RANK
5.1%
MALE UNEMPLOYMENT
88.8/ 100
METRIC RATING
118th/ 347
METRIC RANK
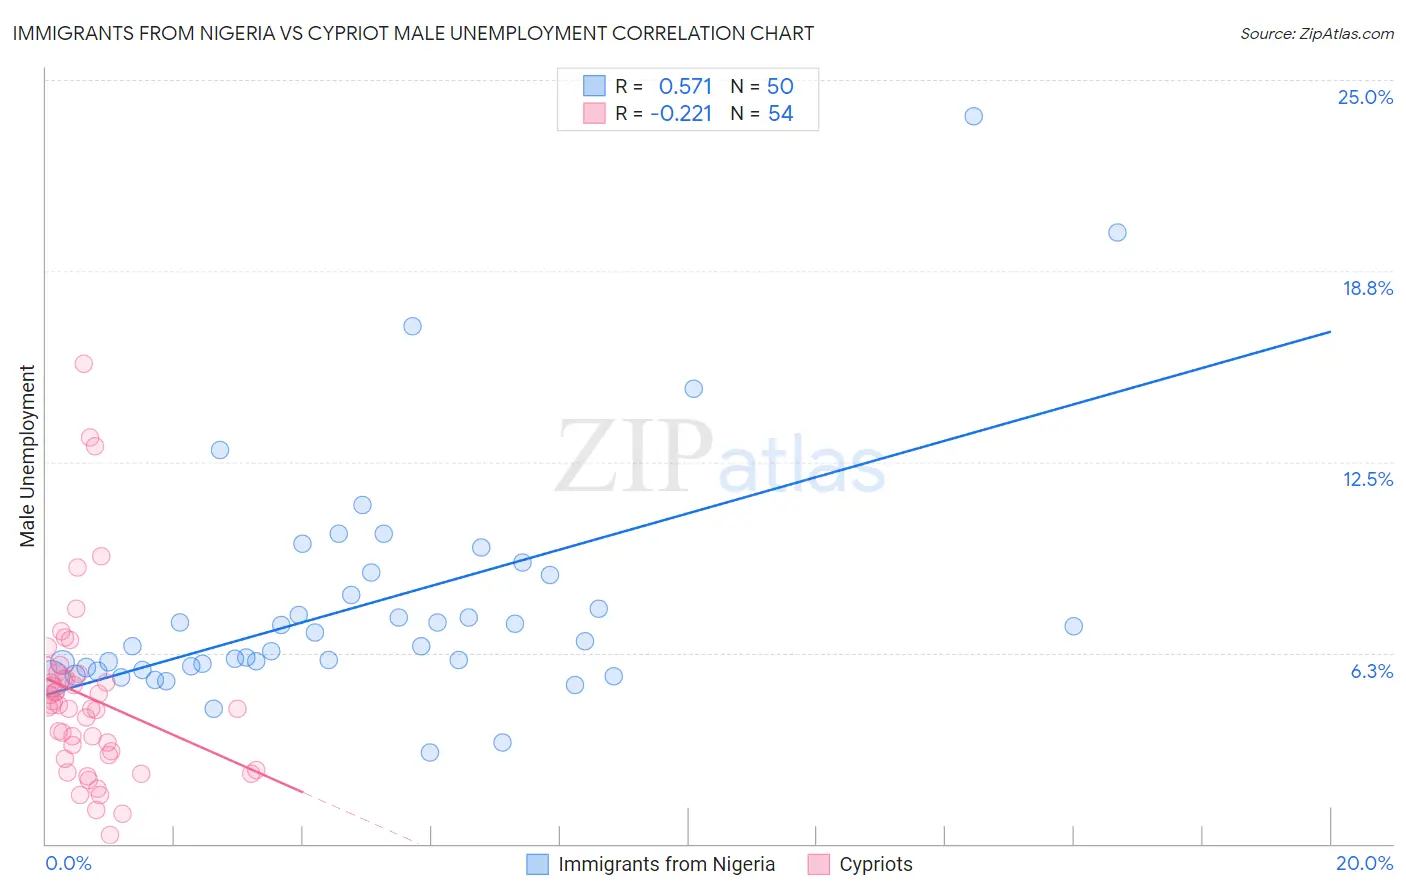
Immigrants from Nigeria vs Cypriot Male Unemployment Correlation Chart
The statistical analysis conducted on geographies consisting of 282,980,898 people shows a substantial positive correlation between the proportion of Immigrants from Nigeria and unemployment rate among males in the United States with a correlation coefficient (R) of 0.571 and weighted average of 6.0%. Similarly, the statistical analysis conducted on geographies consisting of 61,847,118 people shows a weak negative correlation between the proportion of Cypriots and unemployment rate among males in the United States with a correlation coefficient (R) of -0.221 and weighted average of 5.1%, a difference of 15.9%.
Male Unemployment Correlation Summary
| Measurement | Immigrants from Nigeria | Cypriot |
| Minimum | 3.0% | 0.30% |
| Maximum | 23.8% | 15.7% |
| Range | 20.8% | 15.4% |
| Mean | 7.8% | 4.8% |
| Median | 6.6% | 4.5% |
| Interquartile 25% (IQ1) | 5.8% | 2.9% |
| Interquartile 75% (IQ3) | 8.8% | 5.6% |
| Interquartile Range (IQR) | 3.0% | 2.7% |
| Standard Deviation (Sample) | 3.9% | 3.0% |
| Standard Deviation (Population) | 3.9% | 2.9% |
Similar Demographics by Male Unemployment
Demographics Similar to Immigrants from Nigeria by Male Unemployment
In terms of male unemployment, the demographic groups most similar to Immigrants from Nigeria are Subsaharan African (6.0%, a difference of 0.13%), Bermudan (5.9%, a difference of 0.27%), Nigerian (5.9%, a difference of 0.48%), Bahamian (5.9%, a difference of 0.60%), and Blackfeet (6.0%, a difference of 0.64%).
| Demographics | Rating | Rank | Male Unemployment |
| Immigrants | Portugal | 0.1 /100 | #262 | Tragic 5.9% |
| Immigrants | Latin America | 0.1 /100 | #263 | Tragic 5.9% |
| Immigrants | Mexico | 0.0 /100 | #264 | Tragic 5.9% |
| French American Indians | 0.0 /100 | #265 | Tragic 5.9% |
| Bahamians | 0.0 /100 | #266 | Tragic 5.9% |
| Nigerians | 0.0 /100 | #267 | Tragic 5.9% |
| Bermudans | 0.0 /100 | #268 | Tragic 5.9% |
| Immigrants | Nigeria | 0.0 /100 | #269 | Tragic 6.0% |
| Sub-Saharan Africans | 0.0 /100 | #270 | Tragic 6.0% |
| Blackfeet | 0.0 /100 | #271 | Tragic 6.0% |
| Immigrants | Uzbekistan | 0.0 /100 | #272 | Tragic 6.0% |
| Armenians | 0.0 /100 | #273 | Tragic 6.0% |
| Immigrants | Sierra Leone | 0.0 /100 | #274 | Tragic 6.0% |
| Menominee | 0.0 /100 | #275 | Tragic 6.0% |
| Tlingit-Haida | 0.0 /100 | #276 | Tragic 6.0% |
Demographics Similar to Cypriots by Male Unemployment
In terms of male unemployment, the demographic groups most similar to Cypriots are Estonian (5.1%, a difference of 0.030%), French Canadian (5.1%, a difference of 0.040%), Ukrainian (5.1%, a difference of 0.060%), Mongolian (5.1%, a difference of 0.070%), and Immigrants from Denmark (5.1%, a difference of 0.080%).
| Demographics | Rating | Rank | Male Unemployment |
| Immigrants | Eastern Asia | 90.8 /100 | #111 | Exceptional 5.1% |
| Immigrants | Moldova | 90.3 /100 | #112 | Exceptional 5.1% |
| Immigrants | Austria | 90.3 /100 | #113 | Exceptional 5.1% |
| Romanians | 89.8 /100 | #114 | Excellent 5.1% |
| Immigrants | Asia | 89.6 /100 | #115 | Excellent 5.1% |
| Immigrants | Denmark | 89.4 /100 | #116 | Excellent 5.1% |
| Estonians | 89.0 /100 | #117 | Excellent 5.1% |
| Cypriots | 88.8 /100 | #118 | Excellent 5.1% |
| French Canadians | 88.6 /100 | #119 | Excellent 5.1% |
| Ukrainians | 88.4 /100 | #120 | Excellent 5.1% |
| Mongolians | 88.4 /100 | #121 | Excellent 5.1% |
| Nicaraguans | 88.2 /100 | #122 | Excellent 5.1% |
| Palestinians | 87.7 /100 | #123 | Excellent 5.1% |
| Immigrants | Latvia | 87.5 /100 | #124 | Excellent 5.1% |
| Immigrants | Lithuania | 87.2 /100 | #125 | Excellent 5.1% |