West Indian vs Uruguayan Male Unemployment
COMPARE
West Indian
Uruguayan
Male Unemployment
Male Unemployment Comparison
West Indians
Uruguayans
6.7%
MALE UNEMPLOYMENT
0.0/ 100
METRIC RATING
304th/ 347
METRIC RANK
5.1%
MALE UNEMPLOYMENT
93.0/ 100
METRIC RATING
99th/ 347
METRIC RANK
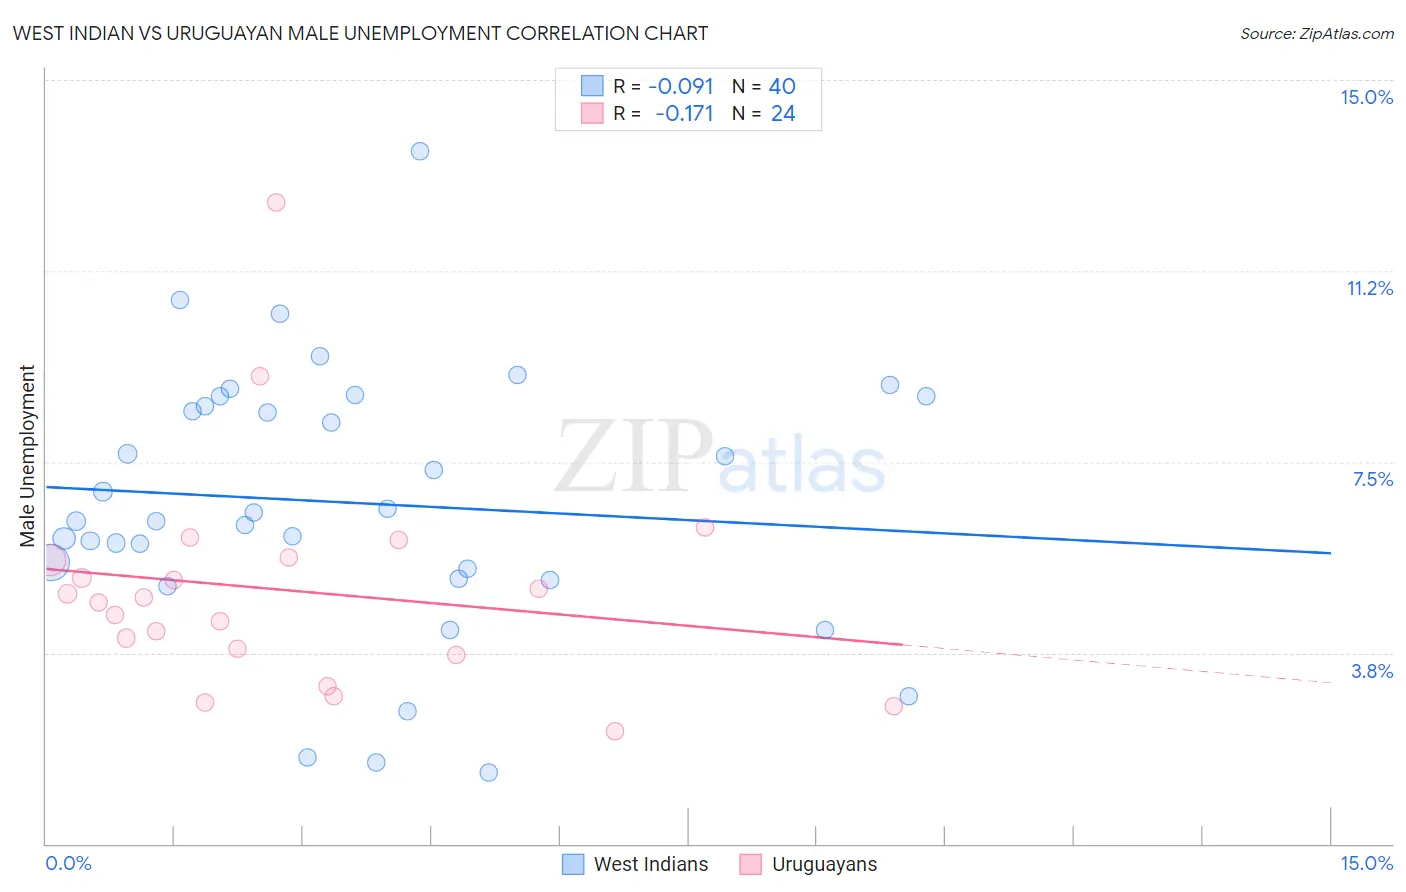
West Indian vs Uruguayan Male Unemployment Correlation Chart
The statistical analysis conducted on geographies consisting of 253,602,585 people shows a slight negative correlation between the proportion of West Indians and unemployment rate among males in the United States with a correlation coefficient (R) of -0.091 and weighted average of 6.7%. Similarly, the statistical analysis conducted on geographies consisting of 144,681,334 people shows a poor negative correlation between the proportion of Uruguayans and unemployment rate among males in the United States with a correlation coefficient (R) of -0.171 and weighted average of 5.1%, a difference of 30.7%.
Male Unemployment Correlation Summary
| Measurement | West Indian | Uruguayan |
| Minimum | 1.4% | 2.2% |
| Maximum | 13.6% | 12.6% |
| Range | 12.2% | 10.4% |
| Mean | 6.7% | 5.0% |
| Median | 6.4% | 4.8% |
| Interquartile 25% (IQ1) | 5.3% | 3.8% |
| Interquartile 75% (IQ3) | 8.7% | 5.6% |
| Interquartile Range (IQR) | 3.4% | 1.8% |
| Standard Deviation (Sample) | 2.6% | 2.2% |
| Standard Deviation (Population) | 2.6% | 2.2% |
Similar Demographics by Male Unemployment
Demographics Similar to West Indians by Male Unemployment
In terms of male unemployment, the demographic groups most similar to West Indians are Immigrants from West Indies (6.7%, a difference of 0.0%), Trinidadian and Tobagonian (6.7%, a difference of 0.32%), Ute (6.6%, a difference of 0.37%), Immigrants from Trinidad and Tobago (6.7%, a difference of 0.52%), and Immigrants from Jamaica (6.7%, a difference of 0.60%).
| Demographics | Rating | Rank | Male Unemployment |
| Chippewa | 0.0 /100 | #297 | Tragic 6.6% |
| Jamaicans | 0.0 /100 | #298 | Tragic 6.6% |
| Immigrants | Bangladesh | 0.0 /100 | #299 | Tragic 6.6% |
| Vietnamese | 0.0 /100 | #300 | Tragic 6.6% |
| Immigrants | Belize | 0.0 /100 | #301 | Tragic 6.6% |
| Ute | 0.0 /100 | #302 | Tragic 6.6% |
| Immigrants | West Indies | 0.0 /100 | #303 | Tragic 6.7% |
| West Indians | 0.0 /100 | #304 | Tragic 6.7% |
| Trinidadians and Tobagonians | 0.0 /100 | #305 | Tragic 6.7% |
| Immigrants | Trinidad and Tobago | 0.0 /100 | #306 | Tragic 6.7% |
| Immigrants | Jamaica | 0.0 /100 | #307 | Tragic 6.7% |
| Aleuts | 0.0 /100 | #308 | Tragic 6.8% |
| Barbadians | 0.0 /100 | #309 | Tragic 6.9% |
| Blacks/African Americans | 0.0 /100 | #310 | Tragic 6.9% |
| Immigrants | Armenia | 0.0 /100 | #311 | Tragic 6.9% |
Demographics Similar to Uruguayans by Male Unemployment
In terms of male unemployment, the demographic groups most similar to Uruguayans are Russian (5.1%, a difference of 0.020%), German Russian (5.1%, a difference of 0.060%), Immigrants from Kuwait (5.1%, a difference of 0.070%), Immigrants from France (5.1%, a difference of 0.070%), and Immigrants from Spain (5.1%, a difference of 0.10%).
| Demographics | Rating | Rank | Male Unemployment |
| Slavs | 94.2 /100 | #92 | Exceptional 5.1% |
| Immigrants | Serbia | 94.2 /100 | #93 | Exceptional 5.1% |
| Canadians | 94.1 /100 | #94 | Exceptional 5.1% |
| Italians | 93.8 /100 | #95 | Exceptional 5.1% |
| Asians | 93.7 /100 | #96 | Exceptional 5.1% |
| Immigrants | Spain | 93.4 /100 | #97 | Exceptional 5.1% |
| Immigrants | Kuwait | 93.3 /100 | #98 | Exceptional 5.1% |
| Uruguayans | 93.0 /100 | #99 | Exceptional 5.1% |
| Russians | 92.9 /100 | #100 | Exceptional 5.1% |
| German Russians | 92.7 /100 | #101 | Exceptional 5.1% |
| Immigrants | France | 92.7 /100 | #102 | Exceptional 5.1% |
| Immigrants | Jordan | 91.9 /100 | #103 | Exceptional 5.1% |
| Immigrants | Chile | 91.8 /100 | #104 | Exceptional 5.1% |
| Immigrants | Czechoslovakia | 91.7 /100 | #105 | Exceptional 5.1% |
| Immigrants | Ethiopia | 91.5 /100 | #106 | Exceptional 5.1% |