Immigrants from Nigeria vs Immigrants from Mexico Male Unemployment
COMPARE
Immigrants from Nigeria
Immigrants from Mexico
Male Unemployment
Male Unemployment Comparison
Immigrants from Nigeria
Immigrants from Mexico
6.0%
MALE UNEMPLOYMENT
0.0/ 100
METRIC RATING
269th/ 347
METRIC RANK
5.9%
MALE UNEMPLOYMENT
0.0/ 100
METRIC RATING
264th/ 347
METRIC RANK
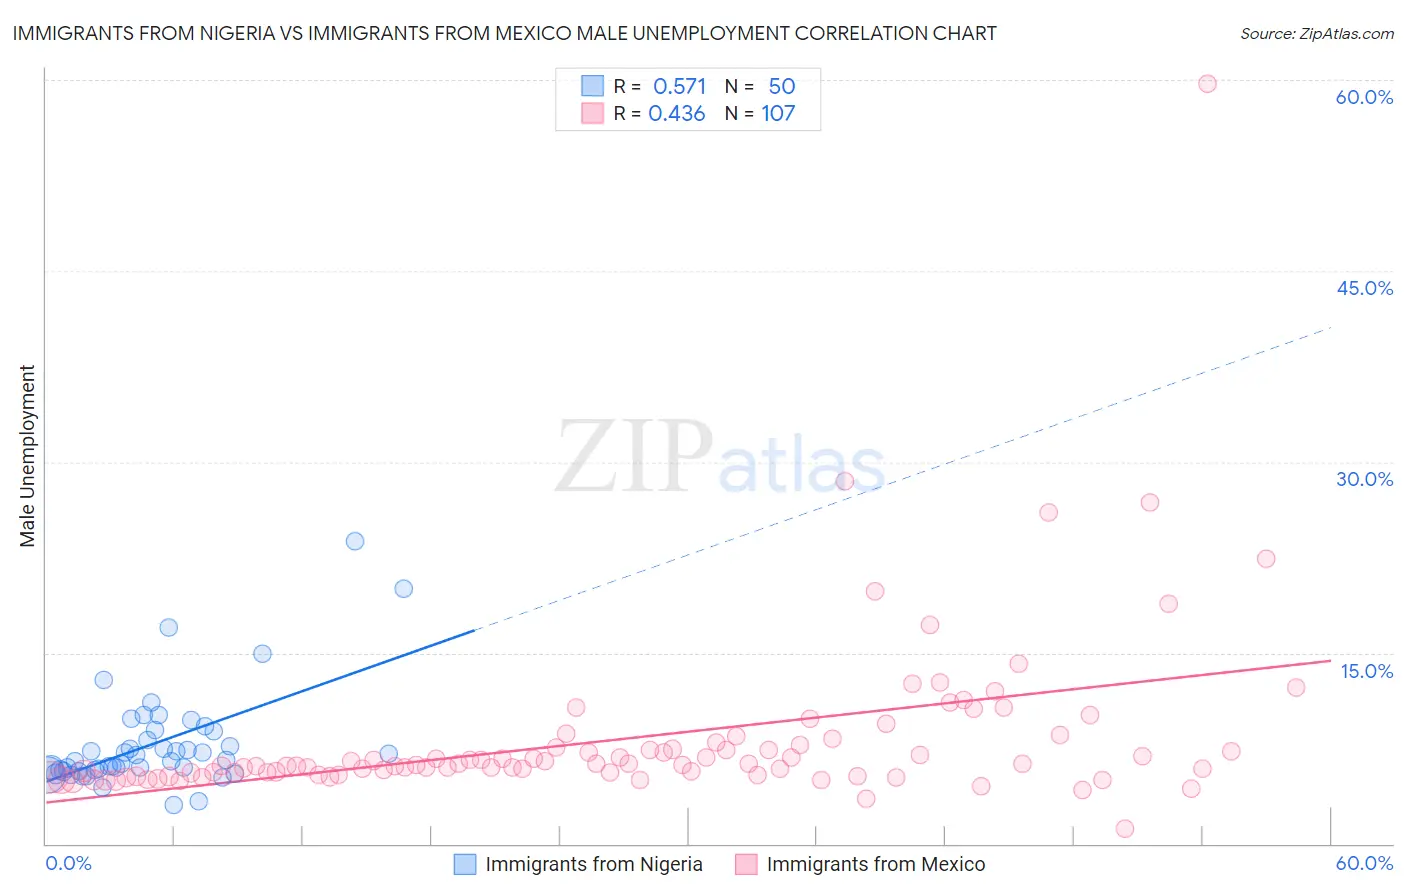
Immigrants from Nigeria vs Immigrants from Mexico Male Unemployment Correlation Chart
The statistical analysis conducted on geographies consisting of 282,980,898 people shows a substantial positive correlation between the proportion of Immigrants from Nigeria and unemployment rate among males in the United States with a correlation coefficient (R) of 0.571 and weighted average of 6.0%. Similarly, the statistical analysis conducted on geographies consisting of 508,075,361 people shows a moderate positive correlation between the proportion of Immigrants from Mexico and unemployment rate among males in the United States with a correlation coefficient (R) of 0.436 and weighted average of 5.9%, a difference of 1.1%.
Male Unemployment Correlation Summary
| Measurement | Immigrants from Nigeria | Immigrants from Mexico |
| Minimum | 3.0% | 1.2% |
| Maximum | 23.8% | 59.7% |
| Range | 20.8% | 58.5% |
| Mean | 7.8% | 8.3% |
| Median | 6.6% | 6.2% |
| Interquartile 25% (IQ1) | 5.8% | 5.4% |
| Interquartile 75% (IQ3) | 8.8% | 7.8% |
| Interquartile Range (IQR) | 3.0% | 2.4% |
| Standard Deviation (Sample) | 3.9% | 6.8% |
| Standard Deviation (Population) | 3.9% | 6.8% |
Demographics Similar to Immigrants from Nigeria and Immigrants from Mexico by Male Unemployment
In terms of male unemployment, the demographic groups most similar to Immigrants from Nigeria are Subsaharan African (6.0%, a difference of 0.13%), Bermudan (5.9%, a difference of 0.27%), Nigerian (5.9%, a difference of 0.48%), Bahamian (5.9%, a difference of 0.60%), and Blackfeet (6.0%, a difference of 0.64%). Similarly, the demographic groups most similar to Immigrants from Mexico are Immigrants from Latin America (5.9%, a difference of 0.22%), French American Indian (5.9%, a difference of 0.39%), Immigrants from Portugal (5.9%, a difference of 0.46%), Bahamian (5.9%, a difference of 0.52%), and Nigerian (5.9%, a difference of 0.65%).
| Demographics | Rating | Rank | Male Unemployment |
| Comanche | 0.2 /100 | #256 | Tragic 5.8% |
| Hispanics or Latinos | 0.1 /100 | #257 | Tragic 5.8% |
| Dutch West Indians | 0.1 /100 | #258 | Tragic 5.8% |
| Cajuns | 0.1 /100 | #259 | Tragic 5.8% |
| Immigrants | Central America | 0.1 /100 | #260 | Tragic 5.8% |
| Liberians | 0.1 /100 | #261 | Tragic 5.8% |
| Immigrants | Portugal | 0.1 /100 | #262 | Tragic 5.9% |
| Immigrants | Latin America | 0.1 /100 | #263 | Tragic 5.9% |
| Immigrants | Mexico | 0.0 /100 | #264 | Tragic 5.9% |
| French American Indians | 0.0 /100 | #265 | Tragic 5.9% |
| Bahamians | 0.0 /100 | #266 | Tragic 5.9% |
| Nigerians | 0.0 /100 | #267 | Tragic 5.9% |
| Bermudans | 0.0 /100 | #268 | Tragic 5.9% |
| Immigrants | Nigeria | 0.0 /100 | #269 | Tragic 6.0% |
| Sub-Saharan Africans | 0.0 /100 | #270 | Tragic 6.0% |
| Blackfeet | 0.0 /100 | #271 | Tragic 6.0% |
| Immigrants | Uzbekistan | 0.0 /100 | #272 | Tragic 6.0% |
| Armenians | 0.0 /100 | #273 | Tragic 6.0% |
| Immigrants | Sierra Leone | 0.0 /100 | #274 | Tragic 6.0% |
| Menominee | 0.0 /100 | #275 | Tragic 6.0% |
| Tlingit-Haida | 0.0 /100 | #276 | Tragic 6.0% |