Immigrants from Austria vs Uruguayan Male Unemployment
COMPARE
Immigrants from Austria
Uruguayan
Male Unemployment
Male Unemployment Comparison
Immigrants from Austria
Uruguayans
5.1%
MALE UNEMPLOYMENT
90.3/ 100
METRIC RATING
113th/ 347
METRIC RANK
5.1%
MALE UNEMPLOYMENT
93.0/ 100
METRIC RATING
99th/ 347
METRIC RANK
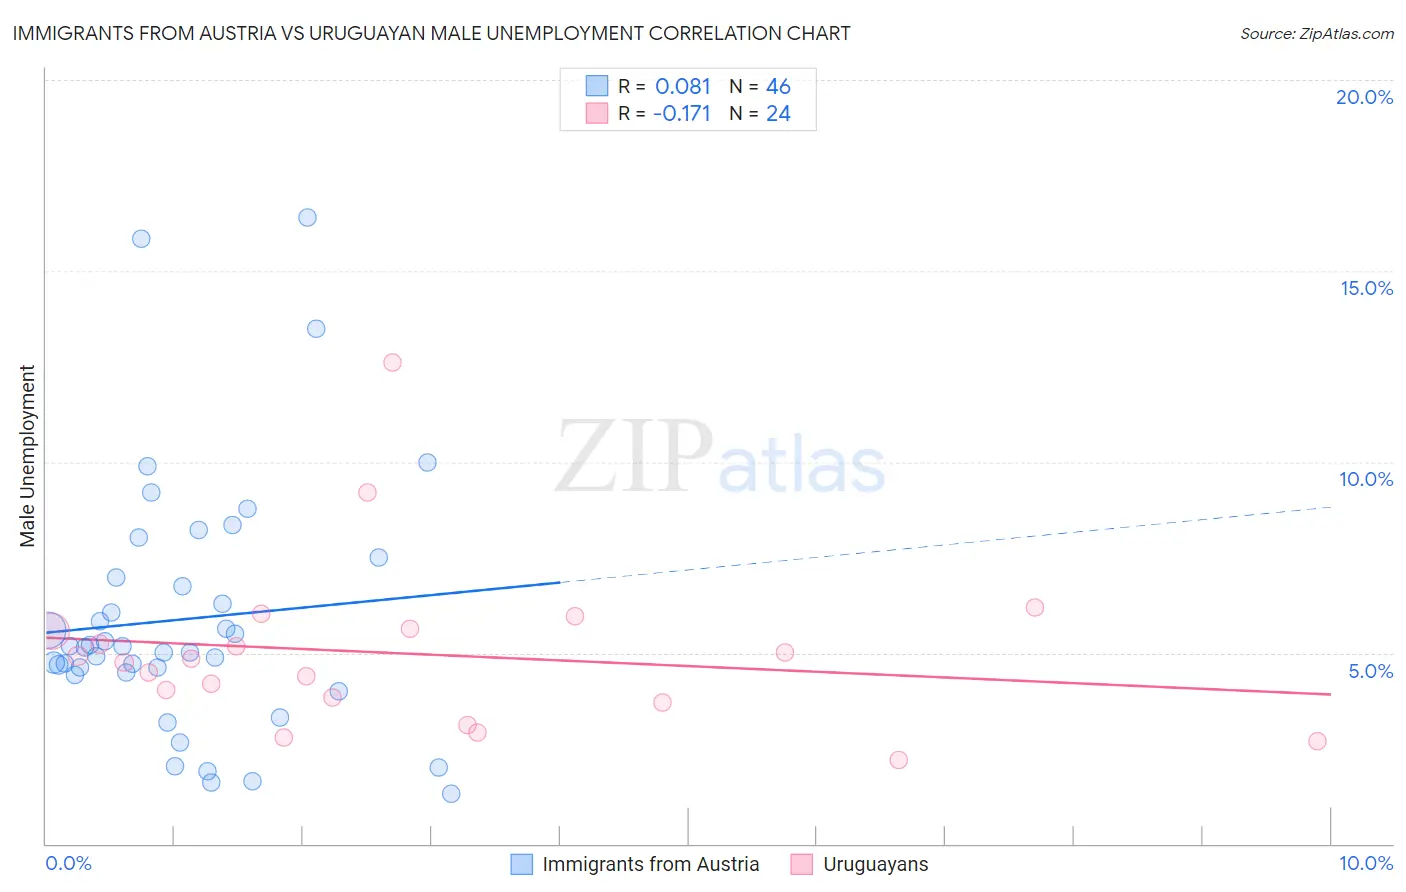
Immigrants from Austria vs Uruguayan Male Unemployment Correlation Chart
The statistical analysis conducted on geographies consisting of 167,645,356 people shows a slight positive correlation between the proportion of Immigrants from Austria and unemployment rate among males in the United States with a correlation coefficient (R) of 0.081 and weighted average of 5.1%. Similarly, the statistical analysis conducted on geographies consisting of 144,681,334 people shows a poor negative correlation between the proportion of Uruguayans and unemployment rate among males in the United States with a correlation coefficient (R) of -0.171 and weighted average of 5.1%, a difference of 0.55%.
Male Unemployment Correlation Summary
| Measurement | Immigrants from Austria | Uruguayan |
| Minimum | 1.3% | 2.2% |
| Maximum | 16.4% | 12.6% |
| Range | 15.1% | 10.4% |
| Mean | 5.9% | 5.0% |
| Median | 5.2% | 4.8% |
| Interquartile 25% (IQ1) | 4.5% | 3.8% |
| Interquartile 75% (IQ3) | 7.0% | 5.6% |
| Interquartile Range (IQR) | 2.5% | 1.8% |
| Standard Deviation (Sample) | 3.3% | 2.2% |
| Standard Deviation (Population) | 3.3% | 2.2% |
Demographics Similar to Immigrants from Austria and Uruguayans by Male Unemployment
In terms of male unemployment, the demographic groups most similar to Immigrants from Austria are Immigrants from Moldova (5.1%, a difference of 0.010%), Romanian (5.1%, a difference of 0.080%), Immigrants from Eastern Asia (5.1%, a difference of 0.090%), Immigrants from England (5.1%, a difference of 0.10%), and Immigrants from Asia (5.1%, a difference of 0.11%). Similarly, the demographic groups most similar to Uruguayans are Russian (5.1%, a difference of 0.020%), German Russian (5.1%, a difference of 0.060%), Immigrants from Kuwait (5.1%, a difference of 0.070%), Immigrants from France (5.1%, a difference of 0.070%), and Immigrants from Spain (5.1%, a difference of 0.10%).
| Demographics | Rating | Rank | Male Unemployment |
| Asians | 93.7 /100 | #96 | Exceptional 5.1% |
| Immigrants | Spain | 93.4 /100 | #97 | Exceptional 5.1% |
| Immigrants | Kuwait | 93.3 /100 | #98 | Exceptional 5.1% |
| Uruguayans | 93.0 /100 | #99 | Exceptional 5.1% |
| Russians | 92.9 /100 | #100 | Exceptional 5.1% |
| German Russians | 92.7 /100 | #101 | Exceptional 5.1% |
| Immigrants | France | 92.7 /100 | #102 | Exceptional 5.1% |
| Immigrants | Jordan | 91.9 /100 | #103 | Exceptional 5.1% |
| Immigrants | Chile | 91.8 /100 | #104 | Exceptional 5.1% |
| Immigrants | Czechoslovakia | 91.7 /100 | #105 | Exceptional 5.1% |
| Immigrants | Ethiopia | 91.5 /100 | #106 | Exceptional 5.1% |
| Ethiopians | 91.3 /100 | #107 | Exceptional 5.1% |
| Immigrants | Nicaragua | 91.2 /100 | #108 | Exceptional 5.1% |
| Immigrants | Pakistan | 90.9 /100 | #109 | Exceptional 5.1% |
| Immigrants | England | 90.8 /100 | #110 | Exceptional 5.1% |
| Immigrants | Eastern Asia | 90.8 /100 | #111 | Exceptional 5.1% |
| Immigrants | Moldova | 90.3 /100 | #112 | Exceptional 5.1% |
| Immigrants | Austria | 90.3 /100 | #113 | Exceptional 5.1% |
| Romanians | 89.8 /100 | #114 | Excellent 5.1% |
| Immigrants | Asia | 89.6 /100 | #115 | Excellent 5.1% |
| Immigrants | Denmark | 89.4 /100 | #116 | Excellent 5.1% |