Immigrants from Italy vs Uruguayan Male Unemployment
COMPARE
Immigrants from Italy
Uruguayan
Male Unemployment
Male Unemployment Comparison
Immigrants from Italy
Uruguayans
5.2%
MALE UNEMPLOYMENT
76.3/ 100
METRIC RATING
148th/ 347
METRIC RANK
5.1%
MALE UNEMPLOYMENT
93.0/ 100
METRIC RATING
99th/ 347
METRIC RANK
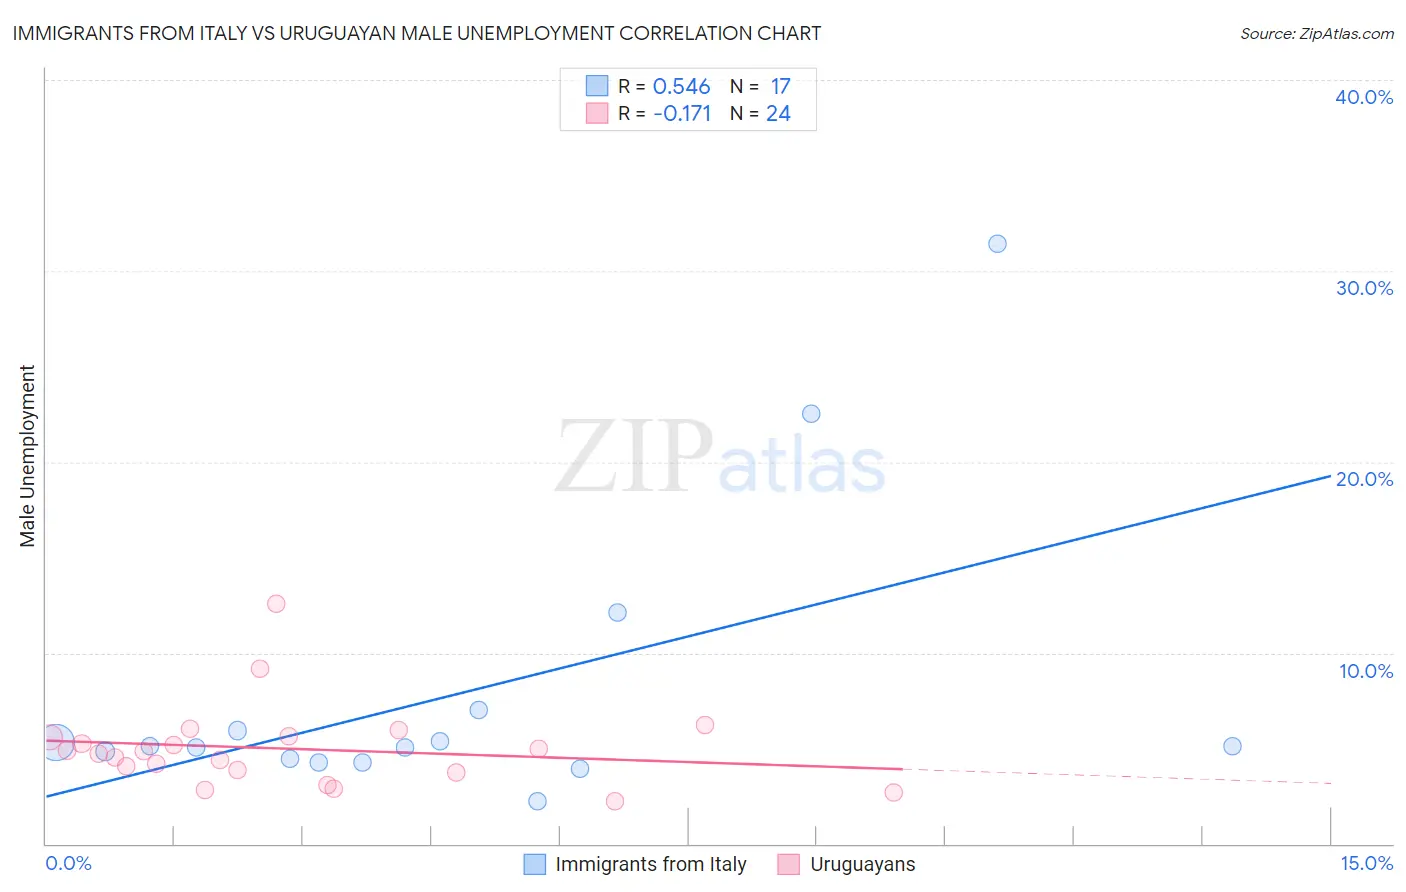
Immigrants from Italy vs Uruguayan Male Unemployment Correlation Chart
The statistical analysis conducted on geographies consisting of 323,258,281 people shows a substantial positive correlation between the proportion of Immigrants from Italy and unemployment rate among males in the United States with a correlation coefficient (R) of 0.546 and weighted average of 5.2%. Similarly, the statistical analysis conducted on geographies consisting of 144,681,334 people shows a poor negative correlation between the proportion of Uruguayans and unemployment rate among males in the United States with a correlation coefficient (R) of -0.171 and weighted average of 5.1%, a difference of 2.1%.
Male Unemployment Correlation Summary
| Measurement | Immigrants from Italy | Uruguayan |
| Minimum | 2.2% | 2.2% |
| Maximum | 31.4% | 12.6% |
| Range | 29.2% | 10.4% |
| Mean | 7.9% | 5.0% |
| Median | 5.1% | 4.8% |
| Interquartile 25% (IQ1) | 4.4% | 3.8% |
| Interquartile 75% (IQ3) | 6.5% | 5.6% |
| Interquartile Range (IQR) | 2.1% | 1.8% |
| Standard Deviation (Sample) | 7.6% | 2.2% |
| Standard Deviation (Population) | 7.4% | 2.2% |
Similar Demographics by Male Unemployment
Demographics Similar to Immigrants from Italy by Male Unemployment
In terms of male unemployment, the demographic groups most similar to Immigrants from Italy are Immigrants from Europe (5.2%, a difference of 0.010%), Indian (Asian) (5.2%, a difference of 0.030%), Slovak (5.2%, a difference of 0.060%), Immigrants from Burma/Myanmar (5.2%, a difference of 0.10%), and Immigrants from Kenya (5.2%, a difference of 0.11%).
| Demographics | Rating | Rank | Male Unemployment |
| Immigrants | Switzerland | 79.2 /100 | #141 | Good 5.2% |
| Fijians | 78.3 /100 | #142 | Good 5.2% |
| Syrians | 78.0 /100 | #143 | Good 5.2% |
| Sri Lankans | 77.9 /100 | #144 | Good 5.2% |
| Macedonians | 77.7 /100 | #145 | Good 5.2% |
| Immigrants | Kenya | 77.6 /100 | #146 | Good 5.2% |
| Immigrants | Burma/Myanmar | 77.5 /100 | #147 | Good 5.2% |
| Immigrants | Italy | 76.3 /100 | #148 | Good 5.2% |
| Immigrants | Europe | 76.2 /100 | #149 | Good 5.2% |
| Indians (Asian) | 76.0 /100 | #150 | Good 5.2% |
| Slovaks | 75.5 /100 | #151 | Good 5.2% |
| Egyptians | 74.8 /100 | #152 | Good 5.2% |
| Immigrants | Uruguay | 73.9 /100 | #153 | Good 5.2% |
| Laotians | 73.8 /100 | #154 | Good 5.2% |
| Immigrants | Hungary | 73.4 /100 | #155 | Good 5.2% |
Demographics Similar to Uruguayans by Male Unemployment
In terms of male unemployment, the demographic groups most similar to Uruguayans are Russian (5.1%, a difference of 0.020%), German Russian (5.1%, a difference of 0.060%), Immigrants from Kuwait (5.1%, a difference of 0.070%), Immigrants from France (5.1%, a difference of 0.070%), and Immigrants from Spain (5.1%, a difference of 0.10%).
| Demographics | Rating | Rank | Male Unemployment |
| Slavs | 94.2 /100 | #92 | Exceptional 5.1% |
| Immigrants | Serbia | 94.2 /100 | #93 | Exceptional 5.1% |
| Canadians | 94.1 /100 | #94 | Exceptional 5.1% |
| Italians | 93.8 /100 | #95 | Exceptional 5.1% |
| Asians | 93.7 /100 | #96 | Exceptional 5.1% |
| Immigrants | Spain | 93.4 /100 | #97 | Exceptional 5.1% |
| Immigrants | Kuwait | 93.3 /100 | #98 | Exceptional 5.1% |
| Uruguayans | 93.0 /100 | #99 | Exceptional 5.1% |
| Russians | 92.9 /100 | #100 | Exceptional 5.1% |
| German Russians | 92.7 /100 | #101 | Exceptional 5.1% |
| Immigrants | France | 92.7 /100 | #102 | Exceptional 5.1% |
| Immigrants | Jordan | 91.9 /100 | #103 | Exceptional 5.1% |
| Immigrants | Chile | 91.8 /100 | #104 | Exceptional 5.1% |
| Immigrants | Czechoslovakia | 91.7 /100 | #105 | Exceptional 5.1% |
| Immigrants | Ethiopia | 91.5 /100 | #106 | Exceptional 5.1% |