Immigrants from Saudi Arabia vs Immigrants from Netherlands Unemployment
COMPARE
Immigrants from Saudi Arabia
Immigrants from Netherlands
Unemployment
Unemployment Comparison
Immigrants from Saudi Arabia
Immigrants from Netherlands
5.1%
UNEMPLOYMENT
85.6/ 100
METRIC RATING
137th/ 347
METRIC RANK
4.9%
UNEMPLOYMENT
99.0/ 100
METRIC RATING
60th/ 347
METRIC RANK
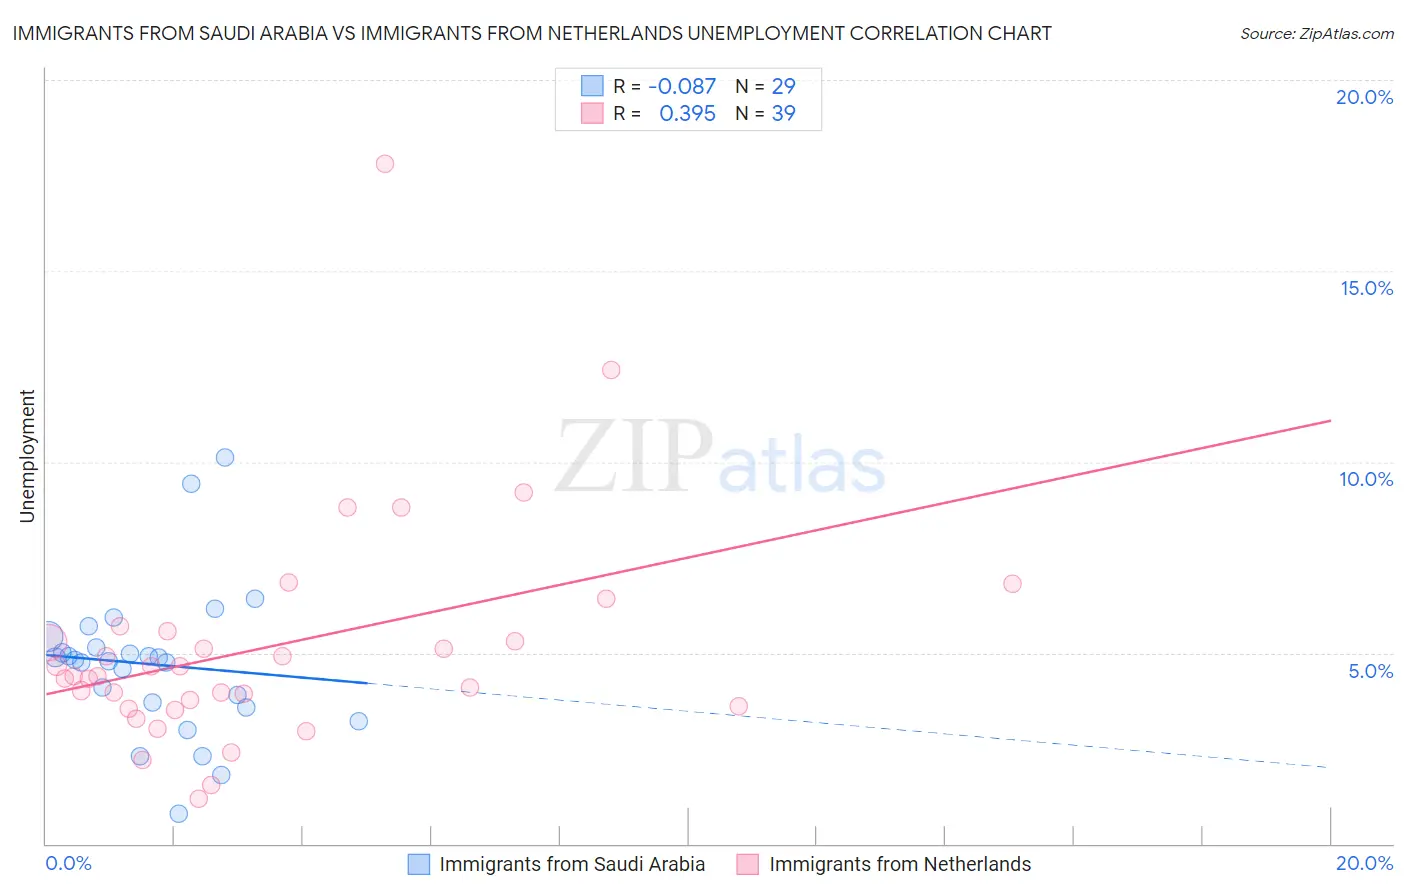
Immigrants from Saudi Arabia vs Immigrants from Netherlands Unemployment Correlation Chart
The statistical analysis conducted on geographies consisting of 164,272,517 people shows a slight negative correlation between the proportion of Immigrants from Saudi Arabia and unemployment in the United States with a correlation coefficient (R) of -0.087 and weighted average of 5.1%. Similarly, the statistical analysis conducted on geographies consisting of 237,753,486 people shows a mild positive correlation between the proportion of Immigrants from Netherlands and unemployment in the United States with a correlation coefficient (R) of 0.395 and weighted average of 4.9%, a difference of 4.6%.
Unemployment Correlation Summary
| Measurement | Immigrants from Saudi Arabia | Immigrants from Netherlands |
| Minimum | 0.80% | 1.2% |
| Maximum | 10.1% | 17.8% |
| Range | 9.3% | 16.6% |
| Mean | 4.7% | 5.2% |
| Median | 4.8% | 4.4% |
| Interquartile 25% (IQ1) | 3.6% | 3.6% |
| Interquartile 75% (IQ3) | 5.3% | 5.6% |
| Interquartile Range (IQR) | 1.6% | 2.0% |
| Standard Deviation (Sample) | 1.9% | 3.0% |
| Standard Deviation (Population) | 1.9% | 3.0% |
Similar Demographics by Unemployment
Demographics Similar to Immigrants from Saudi Arabia by Unemployment
In terms of unemployment, the demographic groups most similar to Immigrants from Saudi Arabia are Immigrants from Hungary (5.1%, a difference of 0.010%), Pakistani (5.1%, a difference of 0.040%), Immigrants from Spain (5.1%, a difference of 0.070%), Immigrants from Burma/Myanmar (5.1%, a difference of 0.080%), and Immigrants from Europe (5.1%, a difference of 0.090%).
| Demographics | Rating | Rank | Unemployment |
| Iranians | 86.9 /100 | #130 | Excellent 5.1% |
| Immigrants | Croatia | 86.8 /100 | #131 | Excellent 5.1% |
| Immigrants | Ethiopia | 86.7 /100 | #132 | Excellent 5.1% |
| Immigrants | Jordan | 86.6 /100 | #133 | Excellent 5.1% |
| Immigrants | Europe | 86.3 /100 | #134 | Excellent 5.1% |
| Immigrants | Burma/Myanmar | 86.2 /100 | #135 | Excellent 5.1% |
| Immigrants | Spain | 86.2 /100 | #136 | Excellent 5.1% |
| Immigrants | Saudi Arabia | 85.6 /100 | #137 | Excellent 5.1% |
| Immigrants | Hungary | 85.6 /100 | #138 | Excellent 5.1% |
| Pakistanis | 85.3 /100 | #139 | Excellent 5.1% |
| Immigrants | Denmark | 84.3 /100 | #140 | Excellent 5.1% |
| Palestinians | 83.4 /100 | #141 | Excellent 5.1% |
| Immigrants | Pakistan | 83.2 /100 | #142 | Excellent 5.1% |
| Immigrants | Chile | 82.8 /100 | #143 | Excellent 5.1% |
| Indonesians | 82.3 /100 | #144 | Excellent 5.1% |
Demographics Similar to Immigrants from Netherlands by Unemployment
In terms of unemployment, the demographic groups most similar to Immigrants from Netherlands are Cambodian (4.9%, a difference of 0.0%), Icelander (4.9%, a difference of 0.010%), Immigrants from Bulgaria (4.9%, a difference of 0.030%), Bhutanese (4.9%, a difference of 0.050%), and Greek (4.9%, a difference of 0.070%).
| Demographics | Rating | Rank | Unemployment |
| Immigrants | Zimbabwe | 99.2 /100 | #53 | Exceptional 4.9% |
| Eastern Europeans | 99.2 /100 | #54 | Exceptional 4.9% |
| Australians | 99.2 /100 | #55 | Exceptional 4.9% |
| Celtics | 99.1 /100 | #56 | Exceptional 4.9% |
| Immigrants | Singapore | 99.1 /100 | #57 | Exceptional 4.9% |
| Greeks | 99.0 /100 | #58 | Exceptional 4.9% |
| Bhutanese | 99.0 /100 | #59 | Exceptional 4.9% |
| Immigrants | Netherlands | 99.0 /100 | #60 | Exceptional 4.9% |
| Cambodians | 99.0 /100 | #61 | Exceptional 4.9% |
| Icelanders | 98.9 /100 | #62 | Exceptional 4.9% |
| Immigrants | Bulgaria | 98.9 /100 | #63 | Exceptional 4.9% |
| Italians | 98.9 /100 | #64 | Exceptional 4.9% |
| Immigrants | Canada | 98.8 /100 | #65 | Exceptional 4.9% |
| Slovaks | 98.7 /100 | #66 | Exceptional 4.9% |
| New Zealanders | 98.6 /100 | #67 | Exceptional 4.9% |