French vs Immigrants from Netherlands Unemployment
COMPARE
French
Immigrants from Netherlands
Unemployment
Unemployment Comparison
French
Immigrants from Netherlands
4.8%
UNEMPLOYMENT
99.5/ 100
METRIC RATING
45th/ 347
METRIC RANK
4.9%
UNEMPLOYMENT
99.0/ 100
METRIC RATING
60th/ 347
METRIC RANK
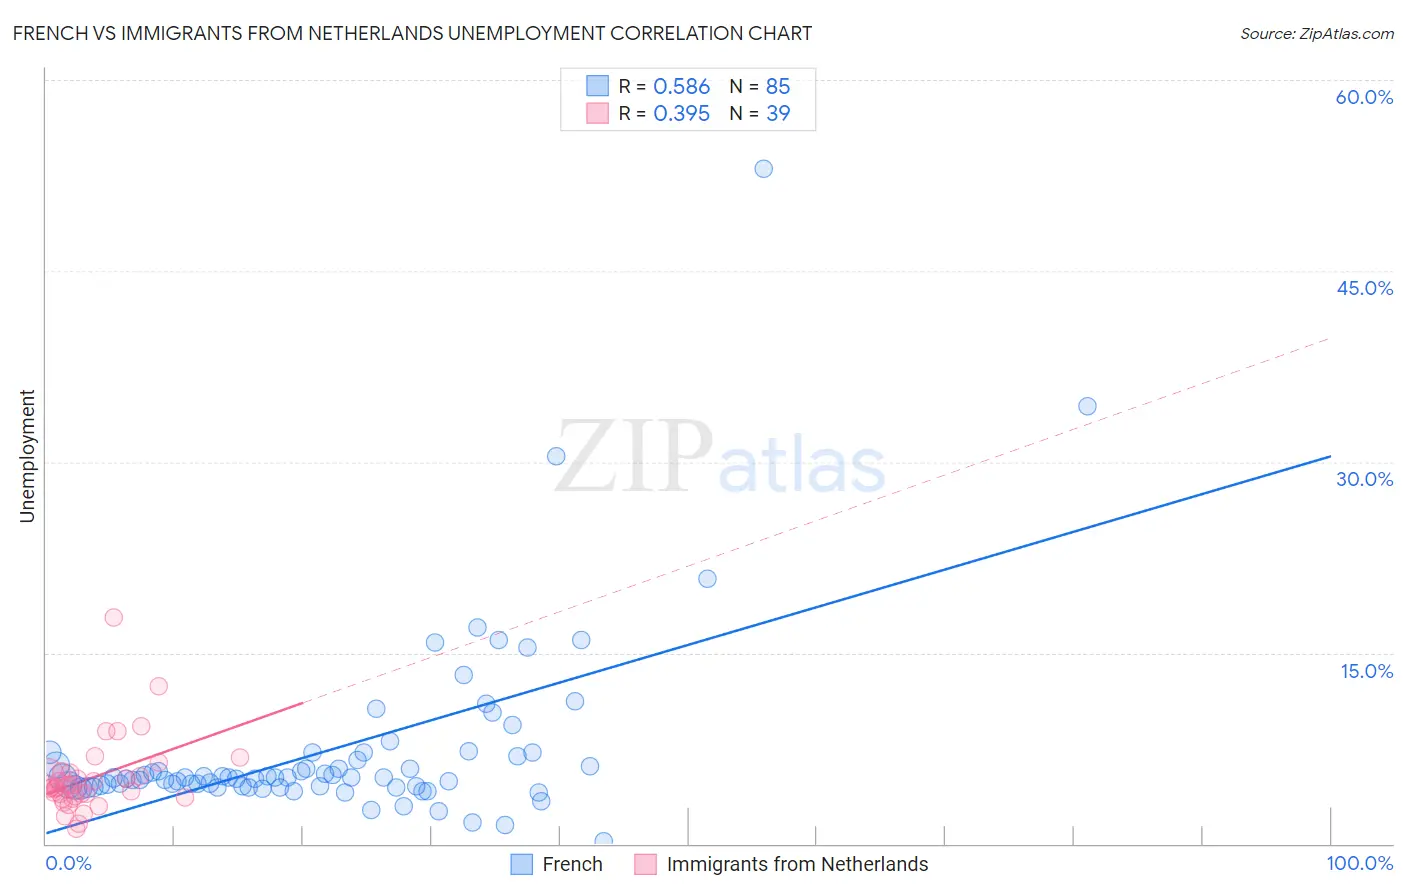
French vs Immigrants from Netherlands Unemployment Correlation Chart
The statistical analysis conducted on geographies consisting of 568,292,844 people shows a substantial positive correlation between the proportion of French and unemployment in the United States with a correlation coefficient (R) of 0.586 and weighted average of 4.8%. Similarly, the statistical analysis conducted on geographies consisting of 237,753,486 people shows a mild positive correlation between the proportion of Immigrants from Netherlands and unemployment in the United States with a correlation coefficient (R) of 0.395 and weighted average of 4.9%, a difference of 1.1%.
Unemployment Correlation Summary
| Measurement | French | Immigrants from Netherlands |
| Minimum | 0.20% | 1.2% |
| Maximum | 53.0% | 17.8% |
| Range | 52.8% | 16.6% |
| Mean | 7.4% | 5.2% |
| Median | 5.2% | 4.4% |
| Interquartile 25% (IQ1) | 4.5% | 3.6% |
| Interquartile 75% (IQ3) | 7.0% | 5.6% |
| Interquartile Range (IQR) | 2.5% | 2.0% |
| Standard Deviation (Sample) | 7.3% | 3.0% |
| Standard Deviation (Population) | 7.3% | 3.0% |
Demographics Similar to French and Immigrants from Netherlands by Unemployment
In terms of unemployment, the demographic groups most similar to French are Austrian (4.8%, a difference of 0.050%), Yugoslavian (4.8%, a difference of 0.11%), Immigrants from Nepal (4.8%, a difference of 0.16%), Immigrants from Taiwan (4.8%, a difference of 0.18%), and Filipino (4.8%, a difference of 0.31%). Similarly, the demographic groups most similar to Immigrants from Netherlands are Cambodian (4.9%, a difference of 0.0%), Icelander (4.9%, a difference of 0.010%), Bhutanese (4.9%, a difference of 0.050%), Greek (4.9%, a difference of 0.070%), and Immigrants from Singapore (4.9%, a difference of 0.17%).
| Demographics | Rating | Rank | Unemployment |
| Filipinos | 99.5 /100 | #42 | Exceptional 4.8% |
| Yugoslavians | 99.5 /100 | #43 | Exceptional 4.8% |
| Austrians | 99.5 /100 | #44 | Exceptional 4.8% |
| French | 99.5 /100 | #45 | Exceptional 4.8% |
| Immigrants | Nepal | 99.4 /100 | #46 | Exceptional 4.8% |
| Immigrants | Taiwan | 99.4 /100 | #47 | Exceptional 4.8% |
| Immigrants | Scotland | 99.3 /100 | #48 | Exceptional 4.9% |
| Immigrants | South Central Asia | 99.3 /100 | #49 | Exceptional 4.9% |
| French Canadians | 99.3 /100 | #50 | Exceptional 4.9% |
| Immigrants | Belgium | 99.2 /100 | #51 | Exceptional 4.9% |
| Whites/Caucasians | 99.2 /100 | #52 | Exceptional 4.9% |
| Immigrants | Zimbabwe | 99.2 /100 | #53 | Exceptional 4.9% |
| Eastern Europeans | 99.2 /100 | #54 | Exceptional 4.9% |
| Australians | 99.2 /100 | #55 | Exceptional 4.9% |
| Celtics | 99.1 /100 | #56 | Exceptional 4.9% |
| Immigrants | Singapore | 99.1 /100 | #57 | Exceptional 4.9% |
| Greeks | 99.0 /100 | #58 | Exceptional 4.9% |
| Bhutanese | 99.0 /100 | #59 | Exceptional 4.9% |
| Immigrants | Netherlands | 99.0 /100 | #60 | Exceptional 4.9% |
| Cambodians | 99.0 /100 | #61 | Exceptional 4.9% |
| Icelanders | 98.9 /100 | #62 | Exceptional 4.9% |