Immigrants from Spain vs Immigrants from Eastern Europe Unemployment
COMPARE
Immigrants from Spain
Immigrants from Eastern Europe
Unemployment
Unemployment Comparison
Immigrants from Spain
Immigrants from Eastern Europe
5.1%
UNEMPLOYMENT
86.2/ 100
METRIC RATING
136th/ 347
METRIC RANK
5.2%
UNEMPLOYMENT
75.3/ 100
METRIC RATING
151st/ 347
METRIC RANK
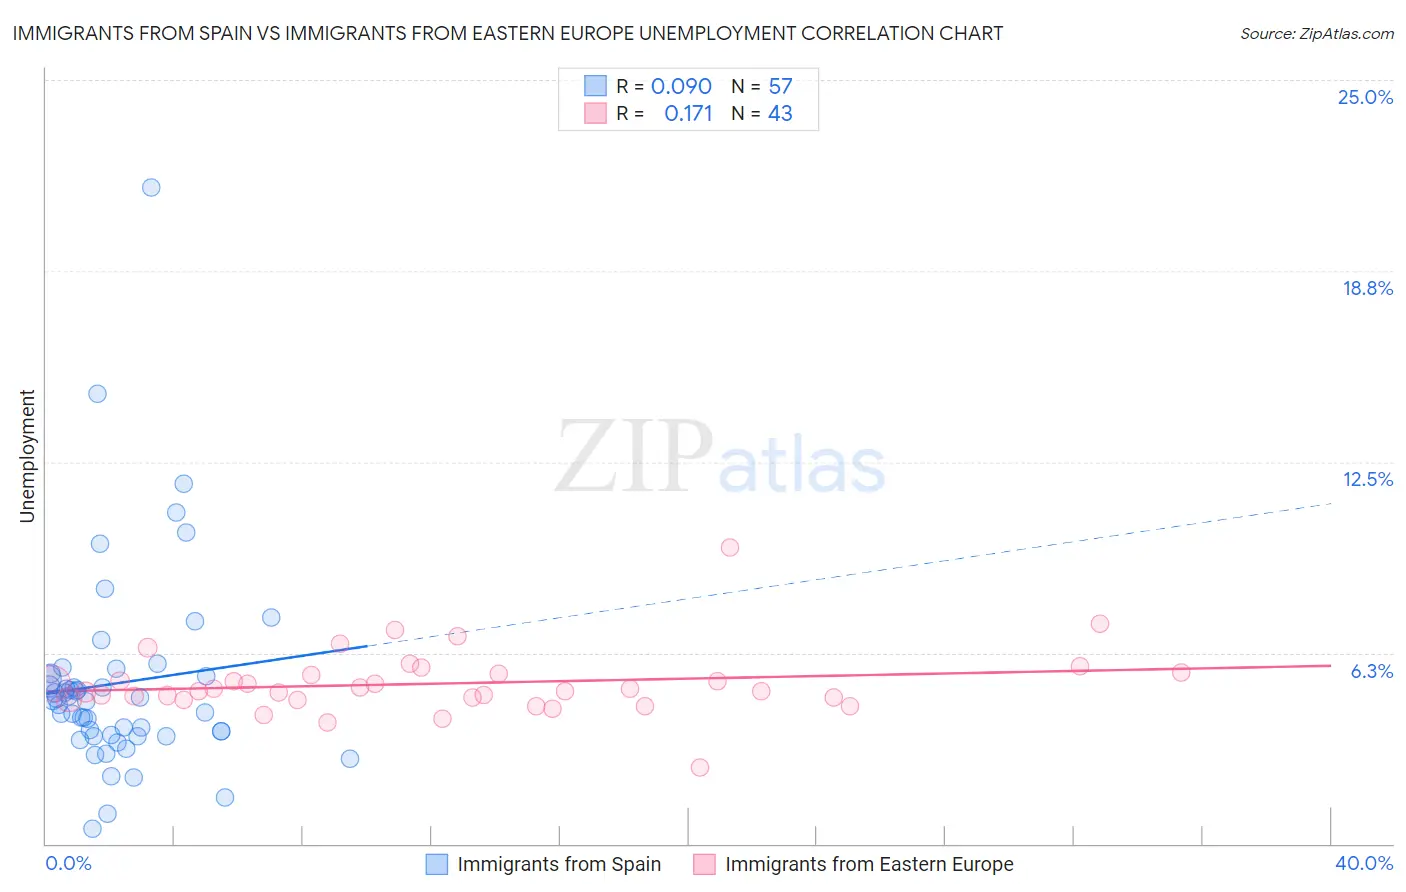
Immigrants from Spain vs Immigrants from Eastern Europe Unemployment Correlation Chart
The statistical analysis conducted on geographies consisting of 239,621,444 people shows a slight positive correlation between the proportion of Immigrants from Spain and unemployment in the United States with a correlation coefficient (R) of 0.090 and weighted average of 5.1%. Similarly, the statistical analysis conducted on geographies consisting of 474,836,774 people shows a poor positive correlation between the proportion of Immigrants from Eastern Europe and unemployment in the United States with a correlation coefficient (R) of 0.171 and weighted average of 5.2%, a difference of 1.1%.
Unemployment Correlation Summary
| Measurement | Immigrants from Spain | Immigrants from Eastern Europe |
| Minimum | 0.50% | 2.5% |
| Maximum | 21.5% | 9.7% |
| Range | 21.0% | 7.2% |
| Mean | 5.3% | 5.2% |
| Median | 4.7% | 5.0% |
| Interquartile 25% (IQ1) | 3.5% | 4.7% |
| Interquartile 75% (IQ3) | 5.5% | 5.6% |
| Interquartile Range (IQR) | 2.0% | 0.84% |
| Standard Deviation (Sample) | 3.4% | 1.1% |
| Standard Deviation (Population) | 3.3% | 1.1% |
Demographics Similar to Immigrants from Spain and Immigrants from Eastern Europe by Unemployment
In terms of unemployment, the demographic groups most similar to Immigrants from Spain are Immigrants from Europe (5.1%, a difference of 0.010%), Immigrants from Burma/Myanmar (5.1%, a difference of 0.010%), Immigrants from Jordan (5.1%, a difference of 0.060%), Immigrants from Saudi Arabia (5.1%, a difference of 0.070%), and Immigrants from Hungary (5.1%, a difference of 0.080%). Similarly, the demographic groups most similar to Immigrants from Eastern Europe are Immigrants from Hong Kong (5.2%, a difference of 0.010%), Egyptian (5.2%, a difference of 0.010%), Potawatomi (5.2%, a difference of 0.070%), Syrian (5.2%, a difference of 0.21%), and Immigrants from Italy (5.1%, a difference of 0.34%).
| Demographics | Rating | Rank | Unemployment |
| Immigrants | Jordan | 86.6 /100 | #133 | Excellent 5.1% |
| Immigrants | Europe | 86.3 /100 | #134 | Excellent 5.1% |
| Immigrants | Burma/Myanmar | 86.2 /100 | #135 | Excellent 5.1% |
| Immigrants | Spain | 86.2 /100 | #136 | Excellent 5.1% |
| Immigrants | Saudi Arabia | 85.6 /100 | #137 | Excellent 5.1% |
| Immigrants | Hungary | 85.6 /100 | #138 | Excellent 5.1% |
| Pakistanis | 85.3 /100 | #139 | Excellent 5.1% |
| Immigrants | Denmark | 84.3 /100 | #140 | Excellent 5.1% |
| Palestinians | 83.4 /100 | #141 | Excellent 5.1% |
| Immigrants | Pakistan | 83.2 /100 | #142 | Excellent 5.1% |
| Immigrants | Chile | 82.8 /100 | #143 | Excellent 5.1% |
| Indonesians | 82.3 /100 | #144 | Excellent 5.1% |
| Immigrants | Norway | 81.8 /100 | #145 | Excellent 5.1% |
| Immigrants | Asia | 81.8 /100 | #146 | Excellent 5.1% |
| Indians (Asian) | 81.6 /100 | #147 | Excellent 5.1% |
| Immigrants | Italy | 79.1 /100 | #148 | Good 5.1% |
| Syrians | 77.7 /100 | #149 | Good 5.2% |
| Potawatomi | 76.2 /100 | #150 | Good 5.2% |
| Immigrants | Eastern Europe | 75.3 /100 | #151 | Good 5.2% |
| Immigrants | Hong Kong | 75.2 /100 | #152 | Good 5.2% |
| Egyptians | 75.2 /100 | #153 | Good 5.2% |