Colombian vs Immigrants from Eastern Europe Unemployment
COMPARE
Colombian
Immigrants from Eastern Europe
Unemployment
Unemployment Comparison
Colombians
Immigrants from Eastern Europe
5.2%
UNEMPLOYMENT
61.1/ 100
METRIC RATING
167th/ 347
METRIC RANK
5.2%
UNEMPLOYMENT
75.3/ 100
METRIC RATING
151st/ 347
METRIC RANK
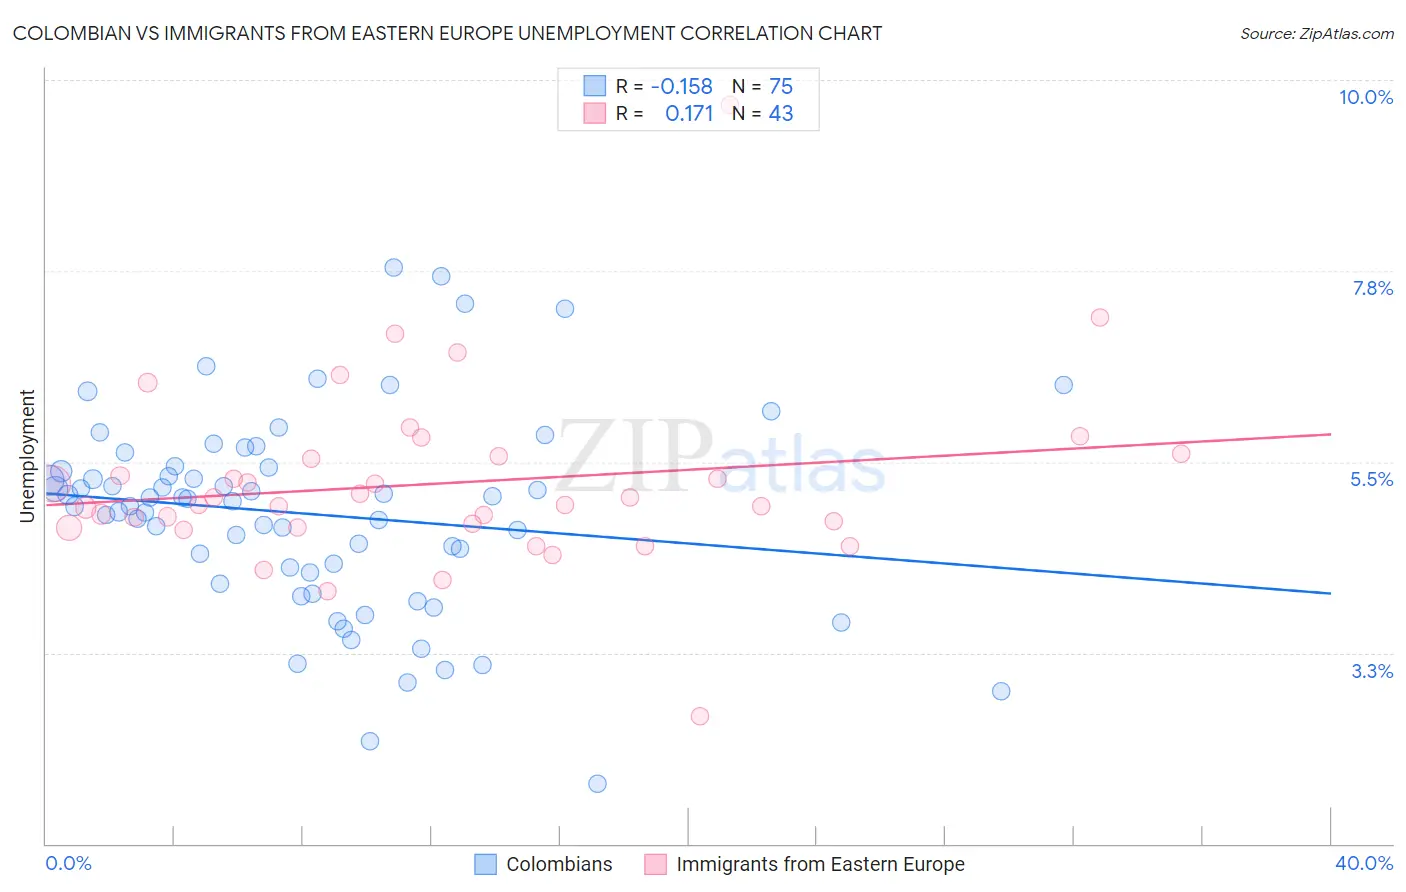
Colombian vs Immigrants from Eastern Europe Unemployment Correlation Chart
The statistical analysis conducted on geographies consisting of 419,300,777 people shows a poor negative correlation between the proportion of Colombians and unemployment in the United States with a correlation coefficient (R) of -0.158 and weighted average of 5.2%. Similarly, the statistical analysis conducted on geographies consisting of 474,836,774 people shows a poor positive correlation between the proportion of Immigrants from Eastern Europe and unemployment in the United States with a correlation coefficient (R) of 0.171 and weighted average of 5.2%, a difference of 1.0%.
Unemployment Correlation Summary
| Measurement | Colombian | Immigrants from Eastern Europe |
| Minimum | 1.7% | 2.5% |
| Maximum | 7.8% | 9.7% |
| Range | 6.1% | 7.2% |
| Mean | 4.9% | 5.2% |
| Median | 5.0% | 5.0% |
| Interquartile 25% (IQ1) | 4.2% | 4.7% |
| Interquartile 75% (IQ3) | 5.4% | 5.6% |
| Interquartile Range (IQR) | 1.2% | 0.84% |
| Standard Deviation (Sample) | 1.2% | 1.1% |
| Standard Deviation (Population) | 1.2% | 1.1% |
Demographics Similar to Colombians and Immigrants from Eastern Europe by Unemployment
In terms of unemployment, the demographic groups most similar to Colombians are Immigrants from Indonesia (5.2%, a difference of 0.010%), Uruguayan (5.2%, a difference of 0.060%), Immigrants from Brazil (5.2%, a difference of 0.13%), Immigrants from Morocco (5.2%, a difference of 0.13%), and Immigrants from Zaire (5.2%, a difference of 0.24%). Similarly, the demographic groups most similar to Immigrants from Eastern Europe are Immigrants from Hong Kong (5.2%, a difference of 0.010%), Egyptian (5.2%, a difference of 0.010%), Immigrants from China (5.2%, a difference of 0.050%), Potawatomi (5.2%, a difference of 0.070%), and Syrian (5.2%, a difference of 0.21%).
| Demographics | Rating | Rank | Unemployment |
| Syrians | 77.7 /100 | #149 | Good 5.2% |
| Potawatomi | 76.2 /100 | #150 | Good 5.2% |
| Immigrants | Eastern Europe | 75.3 /100 | #151 | Good 5.2% |
| Immigrants | Hong Kong | 75.2 /100 | #152 | Good 5.2% |
| Egyptians | 75.2 /100 | #153 | Good 5.2% |
| Immigrants | China | 74.7 /100 | #154 | Good 5.2% |
| Immigrants | Northern Africa | 71.3 /100 | #155 | Good 5.2% |
| Immigrants | Kazakhstan | 70.4 /100 | #156 | Good 5.2% |
| Sri Lankans | 69.5 /100 | #157 | Good 5.2% |
| Immigrants | Egypt | 66.7 /100 | #158 | Good 5.2% |
| Immigrants | Russia | 66.6 /100 | #159 | Good 5.2% |
| Laotians | 66.3 /100 | #160 | Good 5.2% |
| Immigrants | Oceania | 65.2 /100 | #161 | Good 5.2% |
| Spanish | 65.1 /100 | #162 | Good 5.2% |
| Immigrants | Zaire | 64.7 /100 | #163 | Good 5.2% |
| Immigrants | Colombia | 64.7 /100 | #164 | Good 5.2% |
| Immigrants | Brazil | 63.1 /100 | #165 | Good 5.2% |
| Immigrants | Indonesia | 61.2 /100 | #166 | Good 5.2% |
| Colombians | 61.1 /100 | #167 | Good 5.2% |
| Uruguayans | 60.2 /100 | #168 | Good 5.2% |
| Immigrants | Morocco | 59.1 /100 | #169 | Average 5.2% |