Immigrants from Netherlands vs Immigrants from Eastern Africa Cognitive Disability
COMPARE
Immigrants from Netherlands
Immigrants from Eastern Africa
Cognitive Disability
Cognitive Disability Comparison
Immigrants from Netherlands
Immigrants from Eastern Africa
16.7%
COGNITIVE DISABILITY
99.2/ 100
METRIC RATING
81st/ 347
METRIC RANK
18.4%
COGNITIVE DISABILITY
0.0/ 100
METRIC RATING
309th/ 347
METRIC RANK
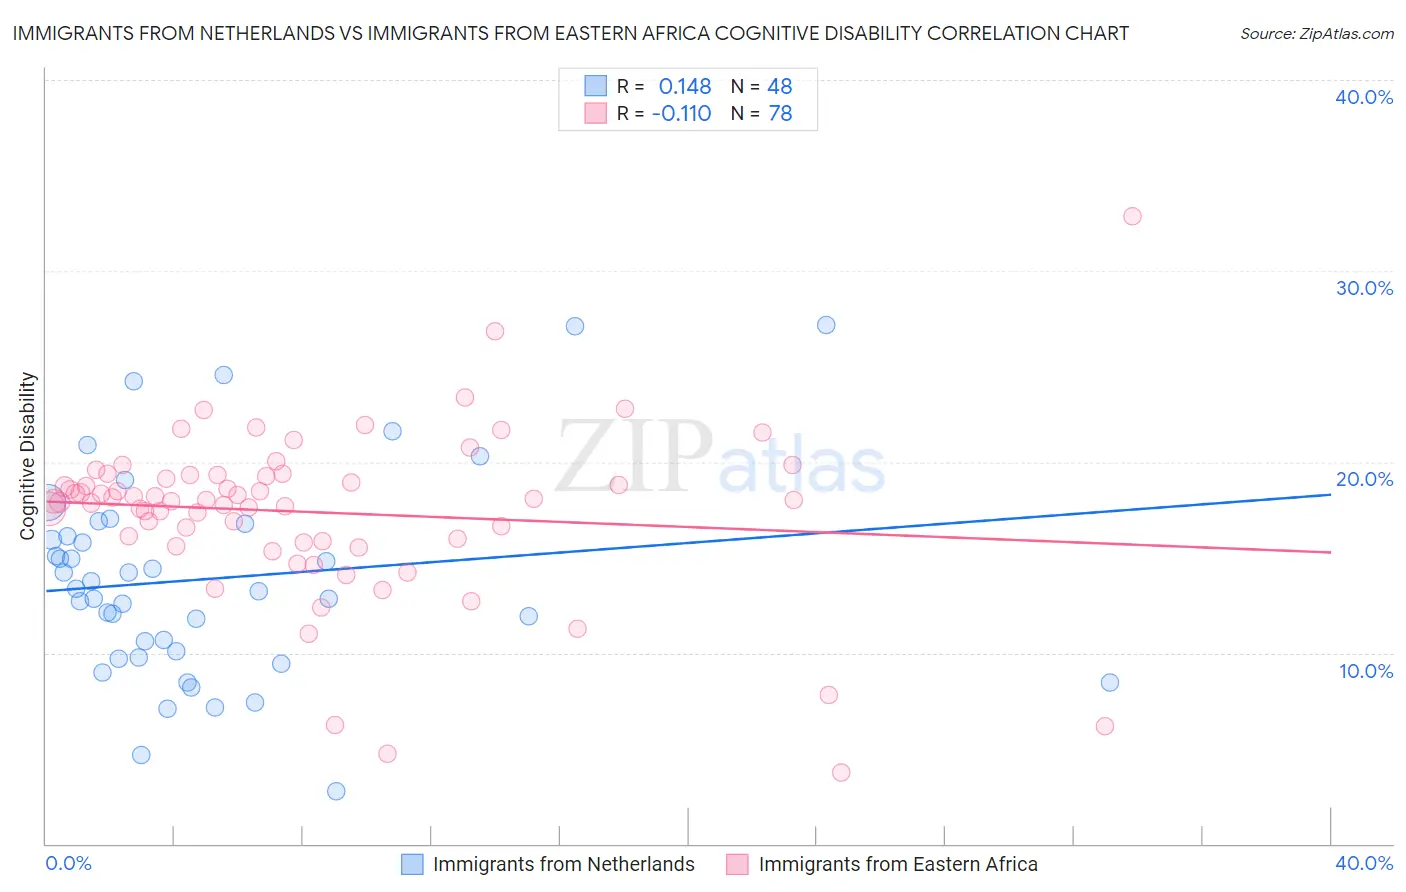
Immigrants from Netherlands vs Immigrants from Eastern Africa Cognitive Disability Correlation Chart
The statistical analysis conducted on geographies consisting of 237,879,934 people shows a poor positive correlation between the proportion of Immigrants from Netherlands and percentage of population with cognitive disability in the United States with a correlation coefficient (R) of 0.148 and weighted average of 16.7%. Similarly, the statistical analysis conducted on geographies consisting of 355,111,422 people shows a poor negative correlation between the proportion of Immigrants from Eastern Africa and percentage of population with cognitive disability in the United States with a correlation coefficient (R) of -0.110 and weighted average of 18.4%, a difference of 10.1%.
Cognitive Disability Correlation Summary
| Measurement | Immigrants from Netherlands | Immigrants from Eastern Africa |
| Minimum | 2.7% | 3.7% |
| Maximum | 27.2% | 32.8% |
| Range | 24.4% | 29.1% |
| Mean | 13.9% | 17.4% |
| Median | 13.3% | 18.0% |
| Interquartile 25% (IQ1) | 9.9% | 15.9% |
| Interquartile 75% (IQ3) | 16.5% | 19.3% |
| Interquartile Range (IQR) | 6.6% | 3.4% |
| Standard Deviation (Sample) | 5.4% | 4.4% |
| Standard Deviation (Population) | 5.4% | 4.4% |
Similar Demographics by Cognitive Disability
Demographics Similar to Immigrants from Netherlands by Cognitive Disability
In terms of cognitive disability, the demographic groups most similar to Immigrants from Netherlands are Egyptian (16.7%, a difference of 0.010%), Swiss (16.7%, a difference of 0.030%), Peruvian (16.7%, a difference of 0.040%), Immigrants from Bulgaria (16.7%, a difference of 0.040%), and Immigrants from Hungary (16.7%, a difference of 0.050%).
| Demographics | Rating | Rank | Cognitive Disability |
| Slavs | 99.3 /100 | #74 | Exceptional 16.7% |
| Estonians | 99.3 /100 | #75 | Exceptional 16.7% |
| Immigrants | Serbia | 99.3 /100 | #76 | Exceptional 16.7% |
| Immigrants | Hungary | 99.3 /100 | #77 | Exceptional 16.7% |
| Peruvians | 99.3 /100 | #78 | Exceptional 16.7% |
| Immigrants | Bulgaria | 99.3 /100 | #79 | Exceptional 16.7% |
| Egyptians | 99.2 /100 | #80 | Exceptional 16.7% |
| Immigrants | Netherlands | 99.2 /100 | #81 | Exceptional 16.7% |
| Swiss | 99.2 /100 | #82 | Exceptional 16.7% |
| Serbians | 99.1 /100 | #83 | Exceptional 16.7% |
| Belgians | 99.1 /100 | #84 | Exceptional 16.7% |
| Immigrants | Moldova | 99.1 /100 | #85 | Exceptional 16.7% |
| Immigrants | South Africa | 99.0 /100 | #86 | Exceptional 16.7% |
| Native Hawaiians | 99.0 /100 | #87 | Exceptional 16.7% |
| Immigrants | Philippines | 99.0 /100 | #88 | Exceptional 16.7% |
Demographics Similar to Immigrants from Eastern Africa by Cognitive Disability
In terms of cognitive disability, the demographic groups most similar to Immigrants from Eastern Africa are Immigrants from Western Africa (18.4%, a difference of 0.040%), Ugandan (18.3%, a difference of 0.12%), Seminole (18.3%, a difference of 0.13%), Colville (18.3%, a difference of 0.14%), and Immigrants from Eritrea (18.3%, a difference of 0.25%).
| Demographics | Rating | Rank | Cognitive Disability |
| Barbadians | 0.0 /100 | #302 | Tragic 18.3% |
| Immigrants | Kenya | 0.0 /100 | #303 | Tragic 18.3% |
| Immigrants | Eritrea | 0.0 /100 | #304 | Tragic 18.3% |
| Colville | 0.0 /100 | #305 | Tragic 18.3% |
| Seminole | 0.0 /100 | #306 | Tragic 18.3% |
| Ugandans | 0.0 /100 | #307 | Tragic 18.3% |
| Immigrants | Western Africa | 0.0 /100 | #308 | Tragic 18.4% |
| Immigrants | Eastern Africa | 0.0 /100 | #309 | Tragic 18.4% |
| Choctaw | 0.0 /100 | #310 | Tragic 18.4% |
| Hmong | 0.0 /100 | #311 | Tragic 18.4% |
| Chickasaw | 0.0 /100 | #312 | Tragic 18.5% |
| Yaqui | 0.0 /100 | #313 | Tragic 18.5% |
| Sub-Saharan Africans | 0.0 /100 | #314 | Tragic 18.5% |
| Immigrants | Dominica | 0.0 /100 | #315 | Tragic 18.6% |
| Immigrants | Middle Africa | 0.0 /100 | #316 | Tragic 18.6% |