Immigrants from Eritrea vs Immigrants from Eastern Africa Unemployment
COMPARE
Immigrants from Eritrea
Immigrants from Eastern Africa
Unemployment
Unemployment Comparison
Immigrants from Eritrea
Immigrants from Eastern Africa
5.0%
UNEMPLOYMENT
93.3/ 100
METRIC RATING
109th/ 347
METRIC RANK
5.1%
UNEMPLOYMENT
88.1/ 100
METRIC RATING
128th/ 347
METRIC RANK
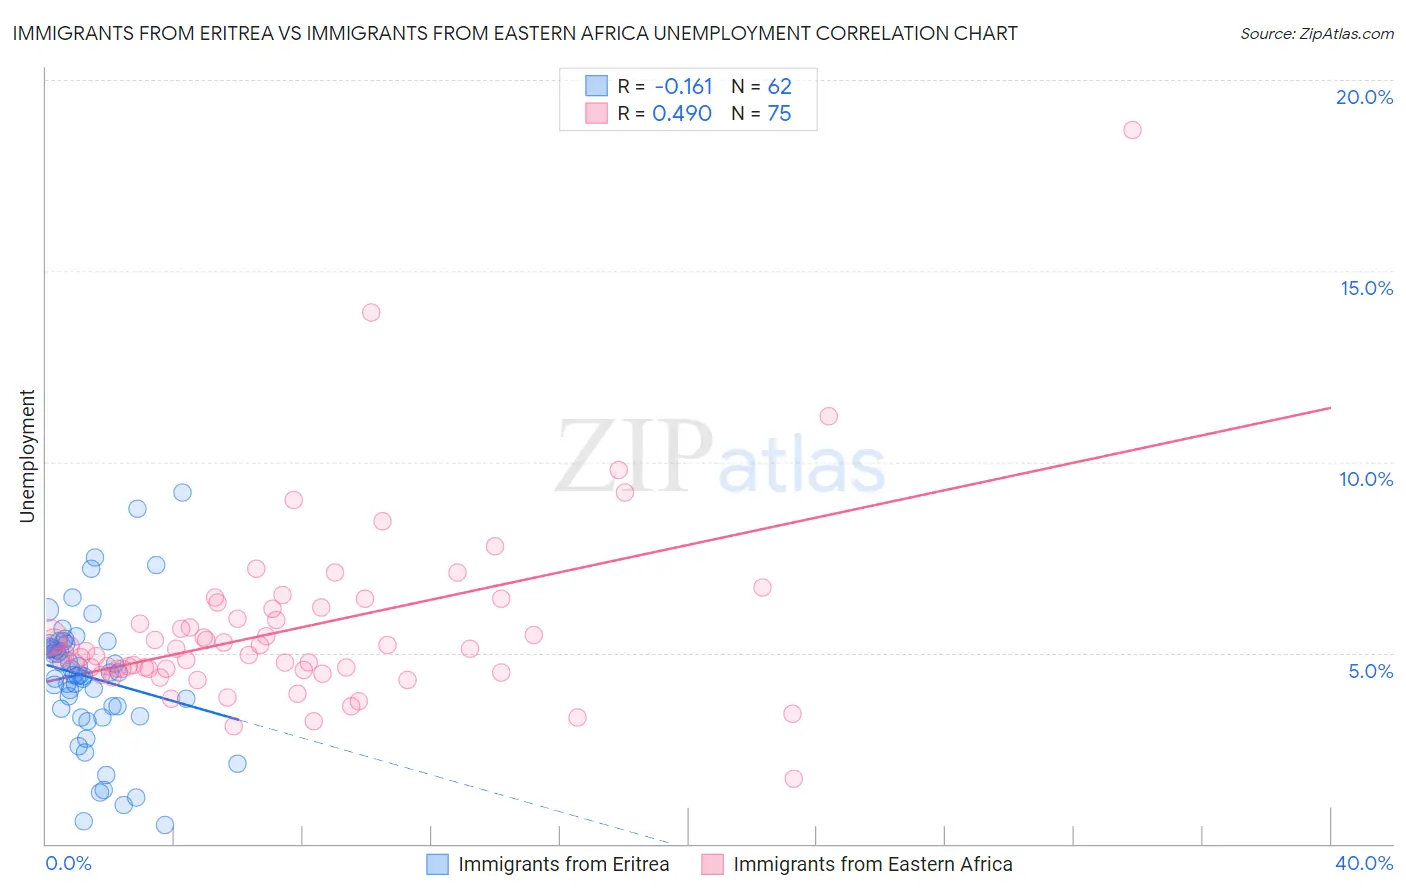
Immigrants from Eritrea vs Immigrants from Eastern Africa Unemployment Correlation Chart
The statistical analysis conducted on geographies consisting of 104,849,484 people shows a poor negative correlation between the proportion of Immigrants from Eritrea and unemployment in the United States with a correlation coefficient (R) of -0.161 and weighted average of 5.0%. Similarly, the statistical analysis conducted on geographies consisting of 354,902,578 people shows a moderate positive correlation between the proportion of Immigrants from Eastern Africa and unemployment in the United States with a correlation coefficient (R) of 0.490 and weighted average of 5.1%, a difference of 1.0%.
Unemployment Correlation Summary
| Measurement | Immigrants from Eritrea | Immigrants from Eastern Africa |
| Minimum | 0.50% | 1.7% |
| Maximum | 9.2% | 18.7% |
| Range | 8.7% | 17.0% |
| Mean | 4.4% | 5.6% |
| Median | 4.5% | 5.0% |
| Interquartile 25% (IQ1) | 3.5% | 4.6% |
| Interquartile 75% (IQ3) | 5.2% | 6.1% |
| Interquartile Range (IQR) | 1.7% | 1.6% |
| Standard Deviation (Sample) | 1.8% | 2.4% |
| Standard Deviation (Population) | 1.7% | 2.4% |
Demographics Similar to Immigrants from Eritrea and Immigrants from Eastern Africa by Unemployment
In terms of unemployment, the demographic groups most similar to Immigrants from Eritrea are Immigrants from Lithuania (5.0%, a difference of 0.020%), Chilean (5.0%, a difference of 0.020%), Immigrants from Kuwait (5.0%, a difference of 0.10%), South African (5.1%, a difference of 0.18%), and Argentinean (5.1%, a difference of 0.21%). Similarly, the demographic groups most similar to Immigrants from Eastern Africa are Kenyan (5.1%, a difference of 0.020%), Immigrants from Kenya (5.1%, a difference of 0.020%), Immigrants from Eastern Asia (5.1%, a difference of 0.040%), Ethiopian (5.1%, a difference of 0.090%), and Asian (5.1%, a difference of 0.14%).
| Demographics | Rating | Rank | Unemployment |
| Immigrants | Kuwait | 93.7 /100 | #108 | Exceptional 5.0% |
| Immigrants | Eritrea | 93.3 /100 | #109 | Exceptional 5.0% |
| Immigrants | Lithuania | 93.2 /100 | #110 | Exceptional 5.0% |
| Chileans | 93.2 /100 | #111 | Exceptional 5.0% |
| South Africans | 92.6 /100 | #112 | Exceptional 5.1% |
| Argentineans | 92.4 /100 | #113 | Exceptional 5.1% |
| Immigrants | Ireland | 92.1 /100 | #114 | Exceptional 5.1% |
| Immigrants | Western Europe | 91.1 /100 | #115 | Exceptional 5.1% |
| Immigrants | Sri Lanka | 91.1 /100 | #116 | Exceptional 5.1% |
| Immigrants | Malaysia | 91.0 /100 | #117 | Exceptional 5.1% |
| Immigrants | Germany | 90.8 /100 | #118 | Exceptional 5.1% |
| Immigrants | France | 89.7 /100 | #119 | Excellent 5.1% |
| Macedonians | 89.7 /100 | #120 | Excellent 5.1% |
| Lebanese | 89.2 /100 | #121 | Excellent 5.1% |
| Immigrants | Switzerland | 89.1 /100 | #122 | Excellent 5.1% |
| Asians | 89.0 /100 | #123 | Excellent 5.1% |
| Ethiopians | 88.6 /100 | #124 | Excellent 5.1% |
| Immigrants | Eastern Asia | 88.3 /100 | #125 | Excellent 5.1% |
| Kenyans | 88.2 /100 | #126 | Excellent 5.1% |
| Immigrants | Kenya | 88.2 /100 | #127 | Excellent 5.1% |
| Immigrants | Eastern Africa | 88.1 /100 | #128 | Excellent 5.1% |