Dominican vs Laotian Unemployment
COMPARE
Dominican
Laotian
Unemployment
Unemployment Comparison
Dominicans
Laotians
7.4%
UNEMPLOYMENT
0.0/ 100
METRIC RATING
331st/ 347
METRIC RANK
5.2%
UNEMPLOYMENT
66.3/ 100
METRIC RATING
160th/ 347
METRIC RANK
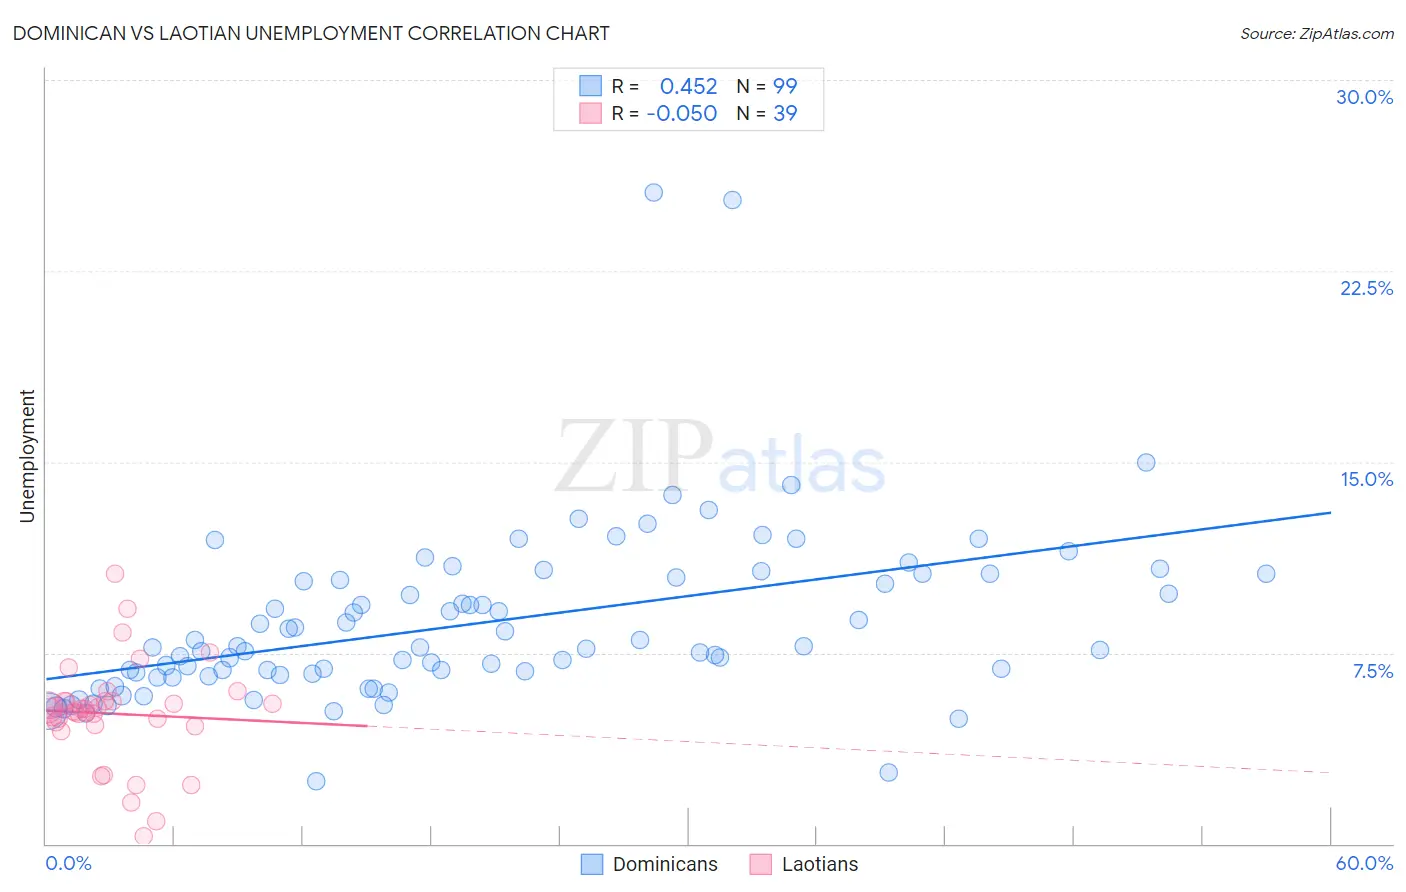
Dominican vs Laotian Unemployment Correlation Chart
The statistical analysis conducted on geographies consisting of 354,741,881 people shows a moderate positive correlation between the proportion of Dominicans and unemployment in the United States with a correlation coefficient (R) of 0.452 and weighted average of 7.4%. Similarly, the statistical analysis conducted on geographies consisting of 224,771,709 people shows a slight negative correlation between the proportion of Laotians and unemployment in the United States with a correlation coefficient (R) of -0.050 and weighted average of 5.2%, a difference of 41.4%.
Unemployment Correlation Summary
| Measurement | Dominican | Laotian |
| Minimum | 2.5% | 0.30% |
| Maximum | 25.6% | 10.6% |
| Range | 23.1% | 10.3% |
| Mean | 8.6% | 5.1% |
| Median | 7.7% | 5.3% |
| Interquartile 25% (IQ1) | 6.6% | 4.7% |
| Interquartile 75% (IQ3) | 10.4% | 5.6% |
| Interquartile Range (IQR) | 3.8% | 0.94% |
| Standard Deviation (Sample) | 3.5% | 2.0% |
| Standard Deviation (Population) | 3.5% | 2.0% |
Similar Demographics by Unemployment
Demographics Similar to Dominicans by Unemployment
In terms of unemployment, the demographic groups most similar to Dominicans are Yakama (7.3%, a difference of 0.33%), Sioux (7.4%, a difference of 0.42%), Immigrants from Dominican Republic (7.4%, a difference of 0.48%), Apache (7.4%, a difference of 0.95%), and Alaska Native (7.2%, a difference of 1.6%).
| Demographics | Rating | Rank | Unemployment |
| Immigrants | Armenia | 0.0 /100 | #324 | Tragic 7.0% |
| Natives/Alaskans | 0.0 /100 | #325 | Tragic 7.0% |
| Paiute | 0.0 /100 | #326 | Tragic 7.1% |
| Pueblo | 0.0 /100 | #327 | Tragic 7.2% |
| Tsimshian | 0.0 /100 | #328 | Tragic 7.2% |
| Alaska Natives | 0.0 /100 | #329 | Tragic 7.2% |
| Yakama | 0.0 /100 | #330 | Tragic 7.3% |
| Dominicans | 0.0 /100 | #331 | Tragic 7.4% |
| Sioux | 0.0 /100 | #332 | Tragic 7.4% |
| Immigrants | Dominican Republic | 0.0 /100 | #333 | Tragic 7.4% |
| Apache | 0.0 /100 | #334 | Tragic 7.4% |
| Alaskan Athabascans | 0.0 /100 | #335 | Tragic 7.7% |
| Immigrants | Yemen | 0.0 /100 | #336 | Tragic 7.7% |
| Cheyenne | 0.0 /100 | #337 | Tragic 8.0% |
| Pima | 0.0 /100 | #338 | Tragic 8.2% |
Demographics Similar to Laotians by Unemployment
In terms of unemployment, the demographic groups most similar to Laotians are Immigrants from Egypt (5.2%, a difference of 0.020%), Immigrants from Russia (5.2%, a difference of 0.020%), Immigrants from Oceania (5.2%, a difference of 0.080%), Spanish (5.2%, a difference of 0.090%), and Immigrants from Zaire (5.2%, a difference of 0.11%).
| Demographics | Rating | Rank | Unemployment |
| Egyptians | 75.2 /100 | #153 | Good 5.2% |
| Immigrants | China | 74.7 /100 | #154 | Good 5.2% |
| Immigrants | Northern Africa | 71.3 /100 | #155 | Good 5.2% |
| Immigrants | Kazakhstan | 70.4 /100 | #156 | Good 5.2% |
| Sri Lankans | 69.5 /100 | #157 | Good 5.2% |
| Immigrants | Egypt | 66.7 /100 | #158 | Good 5.2% |
| Immigrants | Russia | 66.6 /100 | #159 | Good 5.2% |
| Laotians | 66.3 /100 | #160 | Good 5.2% |
| Immigrants | Oceania | 65.2 /100 | #161 | Good 5.2% |
| Spanish | 65.1 /100 | #162 | Good 5.2% |
| Immigrants | Zaire | 64.7 /100 | #163 | Good 5.2% |
| Immigrants | Colombia | 64.7 /100 | #164 | Good 5.2% |
| Immigrants | Brazil | 63.1 /100 | #165 | Good 5.2% |
| Immigrants | Indonesia | 61.2 /100 | #166 | Good 5.2% |
| Colombians | 61.1 /100 | #167 | Good 5.2% |