Immigrants from Morocco vs Cambodian Unemployment Among Ages 55 to 59 years
COMPARE
Immigrants from Morocco
Cambodian
Unemployment Among Ages 55 to 59 years
Unemployment Among Ages 55 to 59 years Comparison
Immigrants from Morocco
Cambodians
4.8%
UNEMPLOYMENT AMONG AGES 55 TO 59 YEARS
36.5/ 100
METRIC RATING
187th/ 347
METRIC RANK
4.6%
UNEMPLOYMENT AMONG AGES 55 TO 59 YEARS
98.0/ 100
METRIC RATING
80th/ 347
METRIC RANK
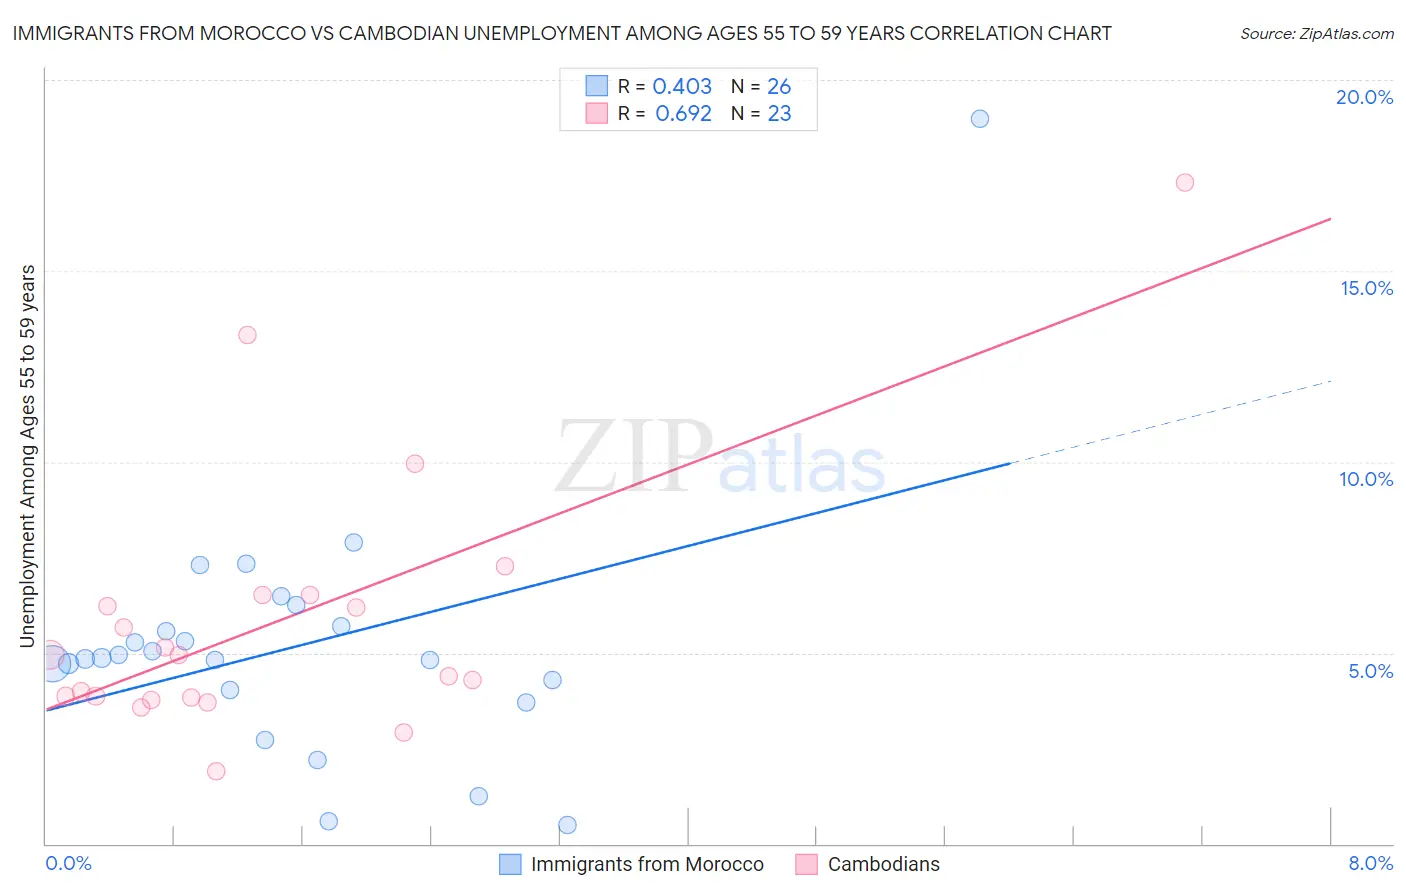
Immigrants from Morocco vs Cambodian Unemployment Among Ages 55 to 59 years Correlation Chart
The statistical analysis conducted on geographies consisting of 174,332,539 people shows a moderate positive correlation between the proportion of Immigrants from Morocco and unemployment rate among population between the ages 55 and 59 in the United States with a correlation coefficient (R) of 0.403 and weighted average of 4.8%. Similarly, the statistical analysis conducted on geographies consisting of 100,608,494 people shows a significant positive correlation between the proportion of Cambodians and unemployment rate among population between the ages 55 and 59 in the United States with a correlation coefficient (R) of 0.692 and weighted average of 4.6%, a difference of 4.7%.
Unemployment Among Ages 55 to 59 years Correlation Summary
| Measurement | Immigrants from Morocco | Cambodian |
| Minimum | 0.50% | 1.9% |
| Maximum | 19.0% | 17.3% |
| Range | 18.5% | 15.4% |
| Mean | 5.2% | 5.8% |
| Median | 4.8% | 4.9% |
| Interquartile 25% (IQ1) | 4.0% | 3.8% |
| Interquartile 75% (IQ3) | 5.7% | 6.5% |
| Interquartile Range (IQR) | 1.7% | 2.7% |
| Standard Deviation (Sample) | 3.4% | 3.5% |
| Standard Deviation (Population) | 3.3% | 3.4% |
Similar Demographics by Unemployment Among Ages 55 to 59 years
Demographics Similar to Immigrants from Morocco by Unemployment Among Ages 55 to 59 years
In terms of unemployment among ages 55 to 59 years, the demographic groups most similar to Immigrants from Morocco are Peruvian (4.8%, a difference of 0.020%), Osage (4.8%, a difference of 0.020%), Immigrants from Eastern Asia (4.8%, a difference of 0.020%), Immigrants from Czechoslovakia (4.8%, a difference of 0.070%), and Immigrants from Peru (4.8%, a difference of 0.090%).
| Demographics | Rating | Rank | Unemployment Among Ages 55 to 59 years |
| South Americans | 44.0 /100 | #180 | Average 4.8% |
| Immigrants | Hungary | 40.4 /100 | #181 | Average 4.8% |
| Immigrants | Europe | 40.4 /100 | #182 | Average 4.8% |
| Immigrants | Peru | 38.6 /100 | #183 | Fair 4.8% |
| Immigrants | Czechoslovakia | 38.0 /100 | #184 | Fair 4.8% |
| Peruvians | 37.0 /100 | #185 | Fair 4.8% |
| Osage | 37.0 /100 | #186 | Fair 4.8% |
| Immigrants | Morocco | 36.5 /100 | #187 | Fair 4.8% |
| Immigrants | Eastern Asia | 36.1 /100 | #188 | Fair 4.8% |
| Iroquois | 34.5 /100 | #189 | Fair 4.9% |
| Russians | 33.9 /100 | #190 | Fair 4.9% |
| Iranians | 32.4 /100 | #191 | Fair 4.9% |
| Immigrants | Ukraine | 31.7 /100 | #192 | Fair 4.9% |
| Immigrants | Italy | 30.1 /100 | #193 | Fair 4.9% |
| Spaniards | 27.2 /100 | #194 | Fair 4.9% |
Demographics Similar to Cambodians by Unemployment Among Ages 55 to 59 years
In terms of unemployment among ages 55 to 59 years, the demographic groups most similar to Cambodians are Sri Lankan (4.6%, a difference of 0.040%), Taiwanese (4.6%, a difference of 0.070%), Latvian (4.6%, a difference of 0.12%), Finnish (4.6%, a difference of 0.13%), and Scotch-Irish (4.6%, a difference of 0.18%).
| Demographics | Rating | Rank | Unemployment Among Ages 55 to 59 years |
| Bhutanese | 98.6 /100 | #73 | Exceptional 4.6% |
| Croatians | 98.5 /100 | #74 | Exceptional 4.6% |
| Immigrants | Iraq | 98.5 /100 | #75 | Exceptional 4.6% |
| Immigrants | Bosnia and Herzegovina | 98.3 /100 | #76 | Exceptional 4.6% |
| Scotch-Irish | 98.3 /100 | #77 | Exceptional 4.6% |
| Finns | 98.2 /100 | #78 | Exceptional 4.6% |
| Sri Lankans | 98.1 /100 | #79 | Exceptional 4.6% |
| Cambodians | 98.0 /100 | #80 | Exceptional 4.6% |
| Taiwanese | 97.9 /100 | #81 | Exceptional 4.6% |
| Latvians | 97.8 /100 | #82 | Exceptional 4.6% |
| Lebanese | 97.5 /100 | #83 | Exceptional 4.6% |
| Malaysians | 96.9 /100 | #84 | Exceptional 4.7% |
| Immigrants | Vietnam | 96.9 /100 | #85 | Exceptional 4.7% |
| Immigrants | Colombia | 96.9 /100 | #86 | Exceptional 4.7% |
| Poles | 96.9 /100 | #87 | Exceptional 4.7% |