Immigrants from Burma/Myanmar vs Cambodian Unemployment
COMPARE
Immigrants from Burma/Myanmar
Cambodian
Unemployment
Unemployment Comparison
Immigrants from Burma/Myanmar
Cambodians
5.1%
UNEMPLOYMENT
86.2/ 100
METRIC RATING
135th/ 347
METRIC RANK
4.9%
UNEMPLOYMENT
99.0/ 100
METRIC RATING
61st/ 347
METRIC RANK
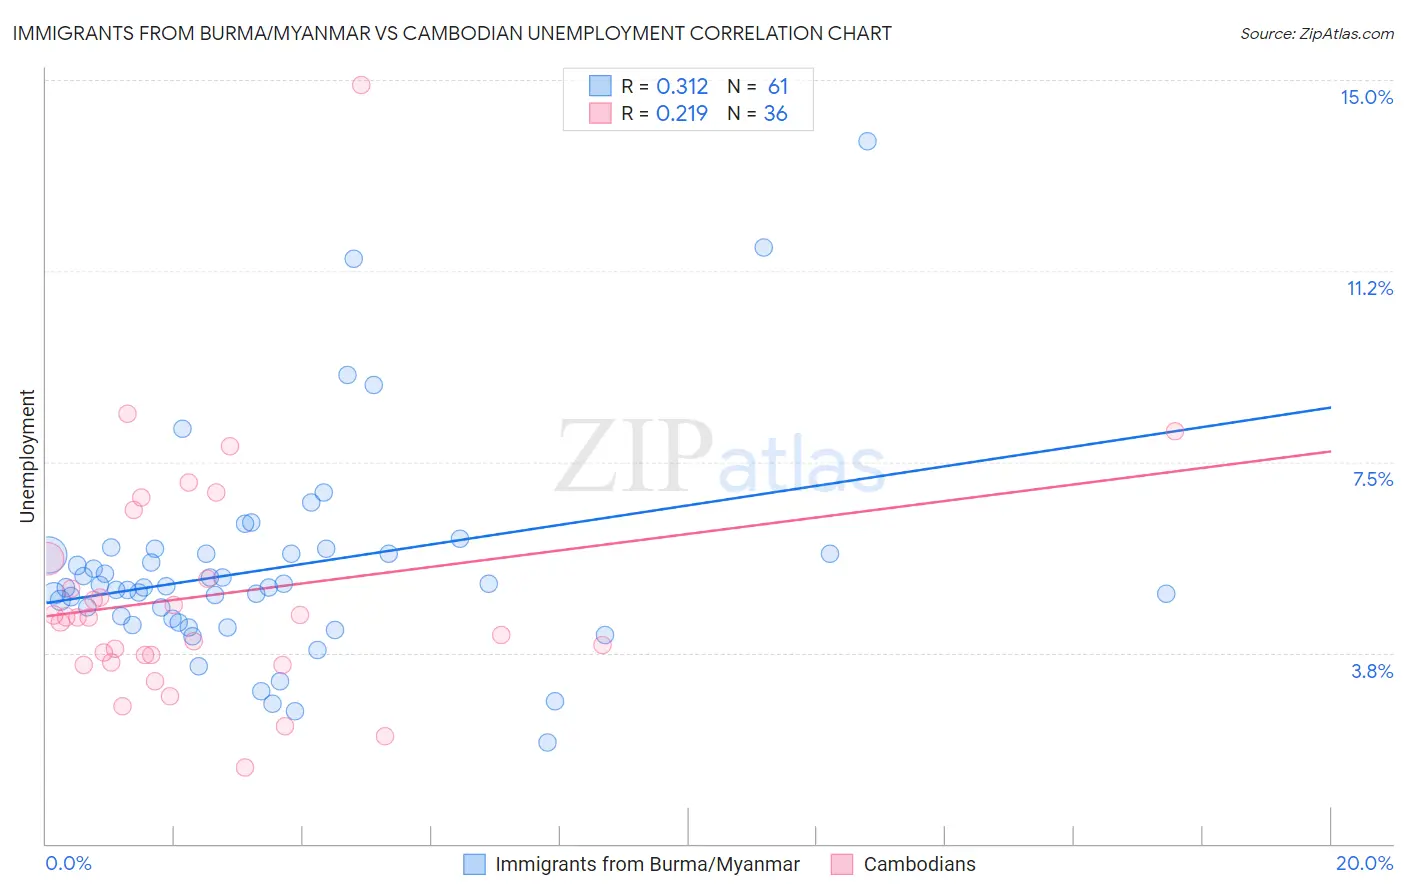
Immigrants from Burma/Myanmar vs Cambodian Unemployment Correlation Chart
The statistical analysis conducted on geographies consisting of 172,291,734 people shows a mild positive correlation between the proportion of Immigrants from Burma/Myanmar and unemployment in the United States with a correlation coefficient (R) of 0.312 and weighted average of 5.1%. Similarly, the statistical analysis conducted on geographies consisting of 102,491,878 people shows a weak positive correlation between the proportion of Cambodians and unemployment in the United States with a correlation coefficient (R) of 0.219 and weighted average of 4.9%, a difference of 4.5%.
Unemployment Correlation Summary
| Measurement | Immigrants from Burma/Myanmar | Cambodian |
| Minimum | 2.0% | 1.5% |
| Maximum | 13.8% | 14.9% |
| Range | 11.8% | 13.4% |
| Mean | 5.4% | 4.9% |
| Median | 5.0% | 4.4% |
| Interquartile 25% (IQ1) | 4.4% | 3.6% |
| Interquartile 75% (IQ3) | 5.7% | 5.4% |
| Interquartile Range (IQR) | 1.3% | 1.8% |
| Standard Deviation (Sample) | 2.1% | 2.4% |
| Standard Deviation (Population) | 2.0% | 2.4% |
Similar Demographics by Unemployment
Demographics Similar to Immigrants from Burma/Myanmar by Unemployment
In terms of unemployment, the demographic groups most similar to Immigrants from Burma/Myanmar are Immigrants from Europe (5.1%, a difference of 0.010%), Immigrants from Spain (5.1%, a difference of 0.010%), Immigrants from Jordan (5.1%, a difference of 0.050%), Immigrants from Ethiopia (5.1%, a difference of 0.060%), and Immigrants from Croatia (5.1%, a difference of 0.070%).
| Demographics | Rating | Rank | Unemployment |
| Immigrants | Eastern Africa | 88.1 /100 | #128 | Excellent 5.1% |
| Immigrants | Latvia | 88.0 /100 | #129 | Excellent 5.1% |
| Iranians | 86.9 /100 | #130 | Excellent 5.1% |
| Immigrants | Croatia | 86.8 /100 | #131 | Excellent 5.1% |
| Immigrants | Ethiopia | 86.7 /100 | #132 | Excellent 5.1% |
| Immigrants | Jordan | 86.6 /100 | #133 | Excellent 5.1% |
| Immigrants | Europe | 86.3 /100 | #134 | Excellent 5.1% |
| Immigrants | Burma/Myanmar | 86.2 /100 | #135 | Excellent 5.1% |
| Immigrants | Spain | 86.2 /100 | #136 | Excellent 5.1% |
| Immigrants | Saudi Arabia | 85.6 /100 | #137 | Excellent 5.1% |
| Immigrants | Hungary | 85.6 /100 | #138 | Excellent 5.1% |
| Pakistanis | 85.3 /100 | #139 | Excellent 5.1% |
| Immigrants | Denmark | 84.3 /100 | #140 | Excellent 5.1% |
| Palestinians | 83.4 /100 | #141 | Excellent 5.1% |
| Immigrants | Pakistan | 83.2 /100 | #142 | Excellent 5.1% |
Demographics Similar to Cambodians by Unemployment
In terms of unemployment, the demographic groups most similar to Cambodians are Immigrants from Netherlands (4.9%, a difference of 0.0%), Icelander (4.9%, a difference of 0.010%), Immigrants from Bulgaria (4.9%, a difference of 0.030%), Bhutanese (4.9%, a difference of 0.050%), and Greek (4.9%, a difference of 0.070%).
| Demographics | Rating | Rank | Unemployment |
| Eastern Europeans | 99.2 /100 | #54 | Exceptional 4.9% |
| Australians | 99.2 /100 | #55 | Exceptional 4.9% |
| Celtics | 99.1 /100 | #56 | Exceptional 4.9% |
| Immigrants | Singapore | 99.1 /100 | #57 | Exceptional 4.9% |
| Greeks | 99.0 /100 | #58 | Exceptional 4.9% |
| Bhutanese | 99.0 /100 | #59 | Exceptional 4.9% |
| Immigrants | Netherlands | 99.0 /100 | #60 | Exceptional 4.9% |
| Cambodians | 99.0 /100 | #61 | Exceptional 4.9% |
| Icelanders | 98.9 /100 | #62 | Exceptional 4.9% |
| Immigrants | Bulgaria | 98.9 /100 | #63 | Exceptional 4.9% |
| Italians | 98.9 /100 | #64 | Exceptional 4.9% |
| Immigrants | Canada | 98.8 /100 | #65 | Exceptional 4.9% |
| Slovaks | 98.7 /100 | #66 | Exceptional 4.9% |
| New Zealanders | 98.6 /100 | #67 | Exceptional 4.9% |
| Slavs | 98.6 /100 | #68 | Exceptional 4.9% |