Immigrants from Middle Africa vs Immigrants from Fiji College, 1 year or more
COMPARE
Immigrants from Middle Africa
Immigrants from Fiji
College, 1 year or more
College, 1 year or more Comparison
Immigrants from Middle Africa
Immigrants from Fiji
58.0%
COLLEGE, 1 YEAR OR MORE
14.0/ 100
METRIC RATING
209th/ 347
METRIC RANK
56.9%
COLLEGE, 1 YEAR OR MORE
4.0/ 100
METRIC RATING
228th/ 347
METRIC RANK
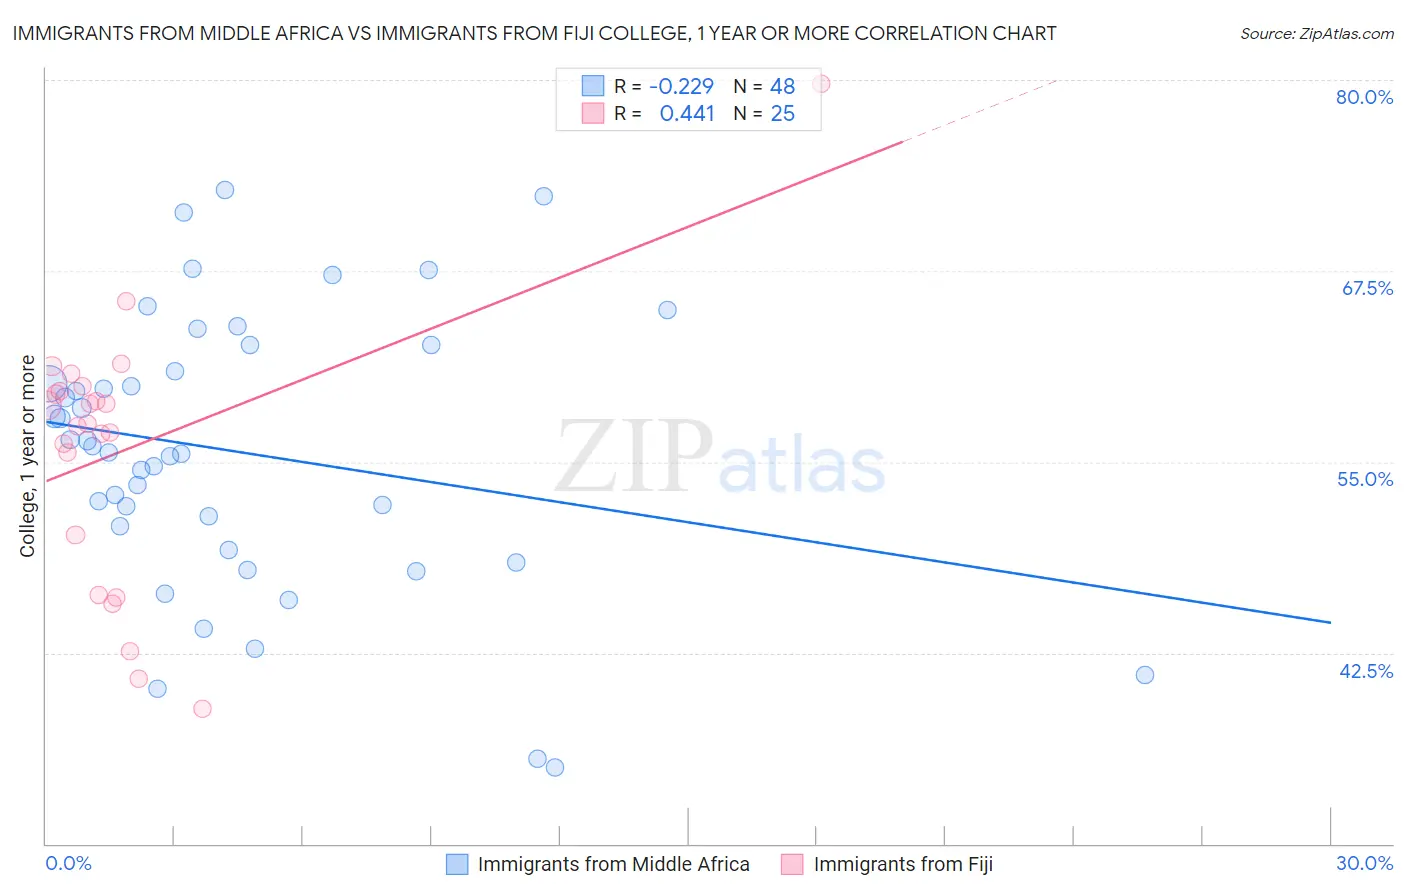
Immigrants from Middle Africa vs Immigrants from Fiji College, 1 year or more Correlation Chart
The statistical analysis conducted on geographies consisting of 202,746,410 people shows a weak negative correlation between the proportion of Immigrants from Middle Africa and percentage of population with at least college, 1 year or more education in the United States with a correlation coefficient (R) of -0.229 and weighted average of 58.0%. Similarly, the statistical analysis conducted on geographies consisting of 93,755,737 people shows a moderate positive correlation between the proportion of Immigrants from Fiji and percentage of population with at least college, 1 year or more education in the United States with a correlation coefficient (R) of 0.441 and weighted average of 56.9%, a difference of 1.9%.
College, 1 year or more Correlation Summary
| Measurement | Immigrants from Middle Africa | Immigrants from Fiji |
| Minimum | 35.0% | 38.9% |
| Maximum | 72.8% | 79.8% |
| Range | 37.9% | 40.9% |
| Mean | 55.6% | 55.8% |
| Median | 55.8% | 57.5% |
| Interquartile 25% (IQ1) | 50.0% | 48.2% |
| Interquartile 75% (IQ3) | 61.8% | 59.8% |
| Interquartile Range (IQR) | 11.8% | 11.5% |
| Standard Deviation (Sample) | 9.1% | 8.8% |
| Standard Deviation (Population) | 9.0% | 8.6% |
Demographics Similar to Immigrants from Middle Africa and Immigrants from Fiji by College, 1 year or more
In terms of college, 1 year or more, the demographic groups most similar to Immigrants from Middle Africa are Tsimshian (57.9%, a difference of 0.060%), Immigrants from Nigeria (57.9%, a difference of 0.080%), Immigrants from Uruguay (58.1%, a difference of 0.13%), Immigrants from Senegal (57.8%, a difference of 0.26%), and French Canadian (57.8%, a difference of 0.26%). Similarly, the demographic groups most similar to Immigrants from Fiji are Immigrants (57.0%, a difference of 0.15%), Immigrants from Western Africa (57.0%, a difference of 0.21%), Vietnamese (57.0%, a difference of 0.24%), Portuguese (57.2%, a difference of 0.45%), and Hmong (57.2%, a difference of 0.45%).
| Demographics | Rating | Rank | College, 1 year or more |
| Immigrants | Uruguay | 15.2 /100 | #208 | Poor 58.1% |
| Immigrants | Middle Africa | 14.0 /100 | #209 | Poor 58.0% |
| Tsimshian | 13.5 /100 | #210 | Poor 57.9% |
| Immigrants | Nigeria | 13.3 /100 | #211 | Poor 57.9% |
| Immigrants | Senegal | 11.8 /100 | #212 | Poor 57.8% |
| French Canadians | 11.8 /100 | #213 | Poor 57.8% |
| Immigrants | Colombia | 11.6 /100 | #214 | Poor 57.8% |
| Tongans | 11.6 /100 | #215 | Poor 57.8% |
| Immigrants | Peru | 10.6 /100 | #216 | Poor 57.7% |
| Immigrants | Panama | 9.1 /100 | #217 | Tragic 57.6% |
| Native Hawaiians | 9.0 /100 | #218 | Tragic 57.6% |
| Whites/Caucasians | 8.7 /100 | #219 | Tragic 57.6% |
| Immigrants | Costa Rica | 8.0 /100 | #220 | Tragic 57.5% |
| Immigrants | Ghana | 7.7 /100 | #221 | Tragic 57.4% |
| Sub-Saharan Africans | 6.1 /100 | #222 | Tragic 57.3% |
| Portuguese | 5.4 /100 | #223 | Tragic 57.2% |
| Hmong | 5.4 /100 | #224 | Tragic 57.2% |
| Vietnamese | 4.7 /100 | #225 | Tragic 57.0% |
| Immigrants | Western Africa | 4.6 /100 | #226 | Tragic 57.0% |
| Immigrants | Immigrants | 4.4 /100 | #227 | Tragic 57.0% |
| Immigrants | Fiji | 4.0 /100 | #228 | Tragic 56.9% |