Immigrants from Middle Africa vs Immigrants from India Unemployment
COMPARE
Immigrants from Middle Africa
Immigrants from India
Unemployment
Unemployment Comparison
Immigrants from Middle Africa
Immigrants from India
5.4%
UNEMPLOYMENT
15.3/ 100
METRIC RATING
213th/ 347
METRIC RANK
4.5%
UNEMPLOYMENT
100.0/ 100
METRIC RATING
7th/ 347
METRIC RANK
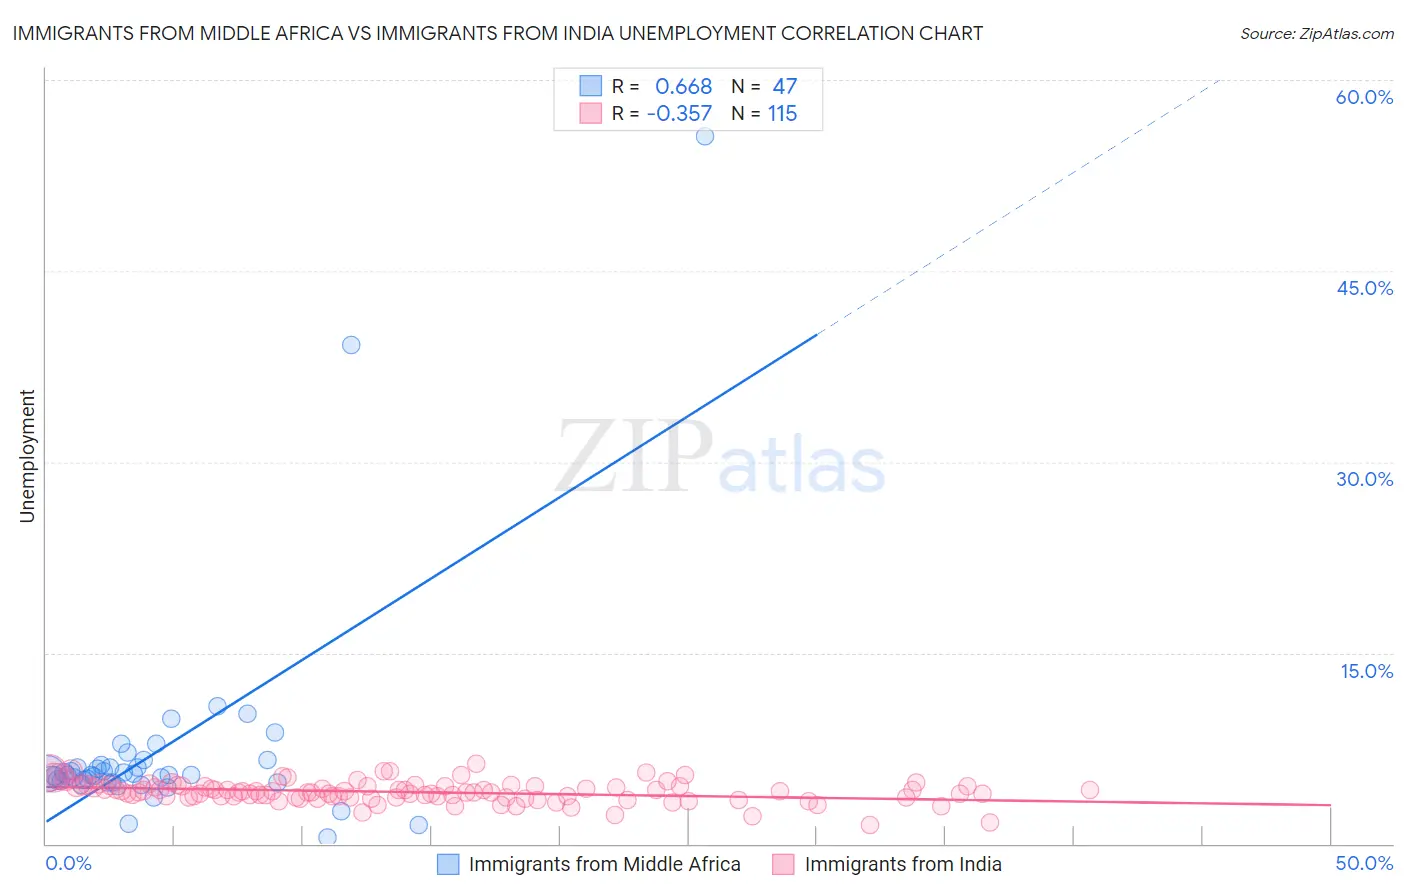
Immigrants from Middle Africa vs Immigrants from India Unemployment Correlation Chart
The statistical analysis conducted on geographies consisting of 202,675,863 people shows a significant positive correlation between the proportion of Immigrants from Middle Africa and unemployment in the United States with a correlation coefficient (R) of 0.668 and weighted average of 5.4%. Similarly, the statistical analysis conducted on geographies consisting of 433,651,365 people shows a mild negative correlation between the proportion of Immigrants from India and unemployment in the United States with a correlation coefficient (R) of -0.357 and weighted average of 4.5%, a difference of 19.7%.
Unemployment Correlation Summary
| Measurement | Immigrants from Middle Africa | Immigrants from India |
| Minimum | 0.50% | 1.5% |
| Maximum | 55.6% | 6.3% |
| Range | 55.1% | 4.8% |
| Mean | 7.3% | 4.1% |
| Median | 5.4% | 4.1% |
| Interquartile 25% (IQ1) | 4.8% | 3.6% |
| Interquartile 75% (IQ3) | 6.1% | 4.5% |
| Interquartile Range (IQR) | 1.3% | 0.85% |
| Standard Deviation (Sample) | 8.9% | 0.80% |
| Standard Deviation (Population) | 8.8% | 0.80% |
Similar Demographics by Unemployment
Demographics Similar to Immigrants from Middle Africa by Unemployment
In terms of unemployment, the demographic groups most similar to Immigrants from Middle Africa are Immigrants from Costa Rica (5.4%, a difference of 0.0%), Delaware (5.4%, a difference of 0.060%), Immigrants from South America (5.4%, a difference of 0.22%), Immigrants from Albania (5.4%, a difference of 0.22%), and Ugandan (5.4%, a difference of 0.29%).
| Demographics | Rating | Rank | Unemployment |
| Immigrants | Peru | 22.7 /100 | #206 | Fair 5.4% |
| Creek | 19.4 /100 | #207 | Poor 5.4% |
| Portuguese | 19.0 /100 | #208 | Poor 5.4% |
| Immigrants | Iran | 18.8 /100 | #209 | Poor 5.4% |
| Immigrants | Iraq | 18.6 /100 | #210 | Poor 5.4% |
| Iraqis | 18.1 /100 | #211 | Poor 5.4% |
| Ugandans | 18.0 /100 | #212 | Poor 5.4% |
| Immigrants | Middle Africa | 15.3 /100 | #213 | Poor 5.4% |
| Immigrants | Costa Rica | 15.2 /100 | #214 | Poor 5.4% |
| Delaware | 14.7 /100 | #215 | Poor 5.4% |
| Immigrants | South America | 13.5 /100 | #216 | Poor 5.4% |
| Immigrants | Albania | 13.5 /100 | #217 | Poor 5.4% |
| Choctaw | 12.7 /100 | #218 | Poor 5.4% |
| Bangladeshis | 11.2 /100 | #219 | Poor 5.4% |
| Soviet Union | 10.6 /100 | #220 | Poor 5.4% |
Demographics Similar to Immigrants from India by Unemployment
In terms of unemployment, the demographic groups most similar to Immigrants from India are Swiss (4.5%, a difference of 0.46%), German (4.5%, a difference of 0.55%), Scandinavian (4.5%, a difference of 0.86%), Swedish (4.4%, a difference of 1.3%), and Dutch (4.6%, a difference of 1.4%).
| Demographics | Rating | Rank | Unemployment |
| Norwegians | 100.0 /100 | #1 | Exceptional 4.2% |
| Luxembourgers | 100.0 /100 | #2 | Exceptional 4.3% |
| Czechs | 100.0 /100 | #3 | Exceptional 4.3% |
| Danes | 100.0 /100 | #4 | Exceptional 4.3% |
| Swedes | 100.0 /100 | #5 | Exceptional 4.4% |
| Germans | 100.0 /100 | #6 | Exceptional 4.5% |
| Immigrants | India | 100.0 /100 | #7 | Exceptional 4.5% |
| Swiss | 100.0 /100 | #8 | Exceptional 4.5% |
| Scandinavians | 100.0 /100 | #9 | Exceptional 4.5% |
| Dutch | 100.0 /100 | #10 | Exceptional 4.6% |
| English | 100.0 /100 | #11 | Exceptional 4.6% |
| Pennsylvania Germans | 100.0 /100 | #12 | Exceptional 4.6% |
| Belgians | 100.0 /100 | #13 | Exceptional 4.6% |
| Immigrants | Cuba | 100.0 /100 | #14 | Exceptional 4.6% |
| Europeans | 99.9 /100 | #15 | Exceptional 4.6% |