Immigrants from Middle Africa vs Immigrants from Philippines Unemployment
COMPARE
Immigrants from Middle Africa
Immigrants from Philippines
Unemployment
Unemployment Comparison
Immigrants from Middle Africa
Immigrants from Philippines
5.4%
UNEMPLOYMENT
15.3/ 100
METRIC RATING
213th/ 347
METRIC RANK
5.4%
UNEMPLOYMENT
10.4/ 100
METRIC RATING
221st/ 347
METRIC RANK
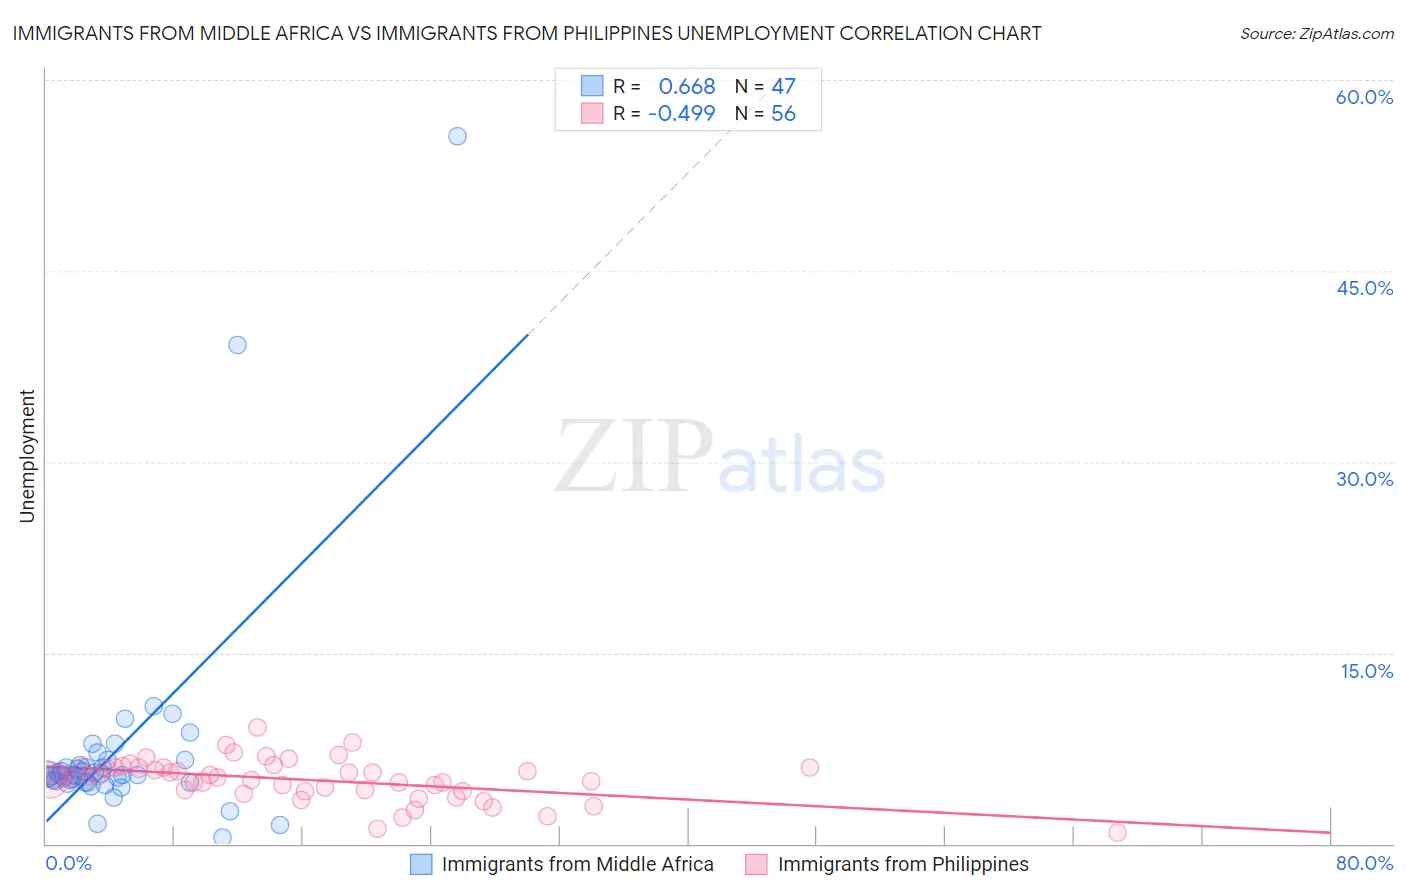
Immigrants from Middle Africa vs Immigrants from Philippines Unemployment Correlation Chart
The statistical analysis conducted on geographies consisting of 202,675,863 people shows a significant positive correlation between the proportion of Immigrants from Middle Africa and unemployment in the United States with a correlation coefficient (R) of 0.668 and weighted average of 5.4%. Similarly, the statistical analysis conducted on geographies consisting of 470,568,280 people shows a moderate negative correlation between the proportion of Immigrants from Philippines and unemployment in the United States with a correlation coefficient (R) of -0.499 and weighted average of 5.4%, a difference of 0.65%.
Unemployment Correlation Summary
| Measurement | Immigrants from Middle Africa | Immigrants from Philippines |
| Minimum | 0.50% | 0.90% |
| Maximum | 55.6% | 9.1% |
| Range | 55.1% | 8.2% |
| Mean | 7.3% | 5.0% |
| Median | 5.4% | 5.3% |
| Interquartile 25% (IQ1) | 4.8% | 4.1% |
| Interquartile 75% (IQ3) | 6.1% | 6.0% |
| Interquartile Range (IQR) | 1.3% | 1.8% |
| Standard Deviation (Sample) | 8.9% | 1.6% |
| Standard Deviation (Population) | 8.8% | 1.6% |
Demographics Similar to Immigrants from Middle Africa and Immigrants from Philippines by Unemployment
In terms of unemployment, the demographic groups most similar to Immigrants from Middle Africa are Immigrants from Costa Rica (5.4%, a difference of 0.0%), Delaware (5.4%, a difference of 0.060%), Immigrants from South America (5.4%, a difference of 0.22%), Immigrants from Albania (5.4%, a difference of 0.22%), and Ugandan (5.4%, a difference of 0.29%). Similarly, the demographic groups most similar to Immigrants from Philippines are Iroquois (5.4%, a difference of 0.020%), Soviet Union (5.4%, a difference of 0.040%), Bangladeshi (5.4%, a difference of 0.12%), Seminole (5.4%, a difference of 0.21%), and Israeli (5.4%, a difference of 0.28%).
| Demographics | Rating | Rank | Unemployment |
| Creek | 19.4 /100 | #207 | Poor 5.4% |
| Portuguese | 19.0 /100 | #208 | Poor 5.4% |
| Immigrants | Iran | 18.8 /100 | #209 | Poor 5.4% |
| Immigrants | Iraq | 18.6 /100 | #210 | Poor 5.4% |
| Iraqis | 18.1 /100 | #211 | Poor 5.4% |
| Ugandans | 18.0 /100 | #212 | Poor 5.4% |
| Immigrants | Middle Africa | 15.3 /100 | #213 | Poor 5.4% |
| Immigrants | Costa Rica | 15.2 /100 | #214 | Poor 5.4% |
| Delaware | 14.7 /100 | #215 | Poor 5.4% |
| Immigrants | South America | 13.5 /100 | #216 | Poor 5.4% |
| Immigrants | Albania | 13.5 /100 | #217 | Poor 5.4% |
| Choctaw | 12.7 /100 | #218 | Poor 5.4% |
| Bangladeshis | 11.2 /100 | #219 | Poor 5.4% |
| Soviet Union | 10.6 /100 | #220 | Poor 5.4% |
| Immigrants | Philippines | 10.4 /100 | #221 | Poor 5.4% |
| Iroquois | 10.3 /100 | #222 | Poor 5.4% |
| Seminole | 9.2 /100 | #223 | Tragic 5.4% |
| Israelis | 8.8 /100 | #224 | Tragic 5.4% |
| South American Indians | 7.8 /100 | #225 | Tragic 5.5% |
| Samoans | 7.1 /100 | #226 | Tragic 5.5% |
| Immigrants | Lebanon | 7.0 /100 | #227 | Tragic 5.5% |