Immigrants from Latvia vs Alsatian Unemployment Among Women with Children Ages 6 to 17 years
COMPARE
Immigrants from Latvia
Alsatian
Unemployment Among Women with Children Ages 6 to 17 years
Unemployment Among Women with Children Ages 6 to 17 years Comparison
Immigrants from Latvia
Alsatians
8.7%
UNEMPLOYMENT AMONG WOMEN WITH CHILDREN AGES 6 TO 17 YEARS
90.4/ 100
METRIC RATING
136th/ 347
METRIC RANK
8.0%
UNEMPLOYMENT AMONG WOMEN WITH CHILDREN AGES 6 TO 17 YEARS
100.0/ 100
METRIC RATING
38th/ 347
METRIC RANK
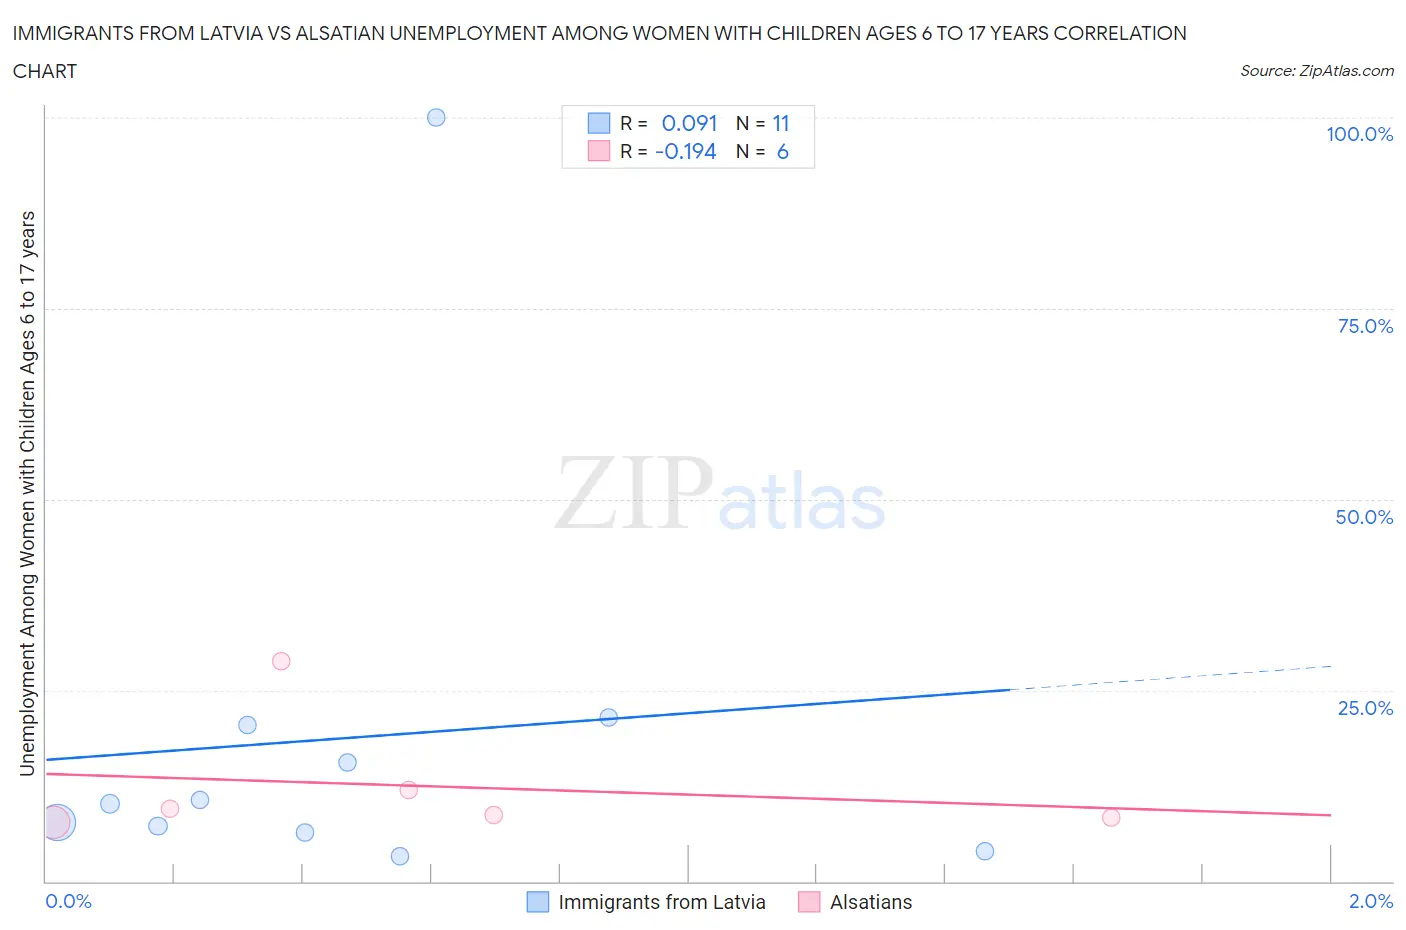
Immigrants from Latvia vs Alsatian Unemployment Among Women with Children Ages 6 to 17 years Correlation Chart
The statistical analysis conducted on geographies consisting of 95,427,578 people shows a slight positive correlation between the proportion of Immigrants from Latvia and unemployment rate among women with children between the ages 6 and 17 in the United States with a correlation coefficient (R) of 0.091 and weighted average of 8.7%. Similarly, the statistical analysis conducted on geographies consisting of 72,025,993 people shows a poor negative correlation between the proportion of Alsatians and unemployment rate among women with children between the ages 6 and 17 in the United States with a correlation coefficient (R) of -0.194 and weighted average of 8.0%, a difference of 9.5%.
Unemployment Among Women with Children Ages 6 to 17 years Correlation Summary
| Measurement | Immigrants from Latvia | Alsatian |
| Minimum | 3.3% | 7.7% |
| Maximum | 100.0% | 28.8% |
| Range | 96.7% | 21.1% |
| Mean | 18.8% | 12.5% |
| Median | 10.2% | 9.1% |
| Interquartile 25% (IQ1) | 6.4% | 8.3% |
| Interquartile 75% (IQ3) | 20.4% | 11.9% |
| Interquartile Range (IQR) | 14.1% | 3.6% |
| Standard Deviation (Sample) | 27.6% | 8.1% |
| Standard Deviation (Population) | 26.3% | 7.4% |
Similar Demographics by Unemployment Among Women with Children Ages 6 to 17 years
Demographics Similar to Immigrants from Latvia by Unemployment Among Women with Children Ages 6 to 17 years
In terms of unemployment among women with children ages 6 to 17 years, the demographic groups most similar to Immigrants from Latvia are European (8.7%, a difference of 0.030%), Immigrants from Argentina (8.7%, a difference of 0.050%), Immigrants from Ireland (8.7%, a difference of 0.090%), Immigrants from Ethiopia (8.8%, a difference of 0.11%), and Northern European (8.8%, a difference of 0.14%).
| Demographics | Rating | Rank | Unemployment Among Women with Children Ages 6 to 17 years |
| Barbadians | 93.8 /100 | #129 | Exceptional 8.7% |
| Immigrants | Western Asia | 93.1 /100 | #130 | Exceptional 8.7% |
| Slavs | 92.2 /100 | #131 | Exceptional 8.7% |
| Yaqui | 92.2 /100 | #132 | Exceptional 8.7% |
| Egyptians | 91.8 /100 | #133 | Exceptional 8.7% |
| Immigrants | Ireland | 91.0 /100 | #134 | Exceptional 8.7% |
| Europeans | 90.6 /100 | #135 | Exceptional 8.7% |
| Immigrants | Latvia | 90.4 /100 | #136 | Exceptional 8.7% |
| Immigrants | Argentina | 90.0 /100 | #137 | Excellent 8.7% |
| Immigrants | Ethiopia | 89.5 /100 | #138 | Excellent 8.8% |
| Northern Europeans | 89.2 /100 | #139 | Excellent 8.8% |
| Immigrants | Poland | 88.3 /100 | #140 | Excellent 8.8% |
| Serbians | 87.6 /100 | #141 | Excellent 8.8% |
| Immigrants | Austria | 87.5 /100 | #142 | Excellent 8.8% |
| Immigrants | Kenya | 86.1 /100 | #143 | Excellent 8.8% |
Demographics Similar to Alsatians by Unemployment Among Women with Children Ages 6 to 17 years
In terms of unemployment among women with children ages 6 to 17 years, the demographic groups most similar to Alsatians are Somali (8.0%, a difference of 0.14%), Asian (8.0%, a difference of 0.33%), Burmese (8.0%, a difference of 0.36%), Immigrants from Zimbabwe (8.0%, a difference of 0.43%), and Immigrants from South Central Asia (7.9%, a difference of 0.44%).
| Demographics | Rating | Rank | Unemployment Among Women with Children Ages 6 to 17 years |
| Laotians | 100.0 /100 | #31 | Exceptional 7.9% |
| Immigrants | Cambodia | 100.0 /100 | #32 | Exceptional 7.9% |
| Immigrants | Korea | 100.0 /100 | #33 | Exceptional 7.9% |
| Native Hawaiians | 100.0 /100 | #34 | Exceptional 7.9% |
| Immigrants | South Central Asia | 100.0 /100 | #35 | Exceptional 7.9% |
| Burmese | 100.0 /100 | #36 | Exceptional 8.0% |
| Asians | 100.0 /100 | #37 | Exceptional 8.0% |
| Alsatians | 100.0 /100 | #38 | Exceptional 8.0% |
| Somalis | 100.0 /100 | #39 | Exceptional 8.0% |
| Immigrants | Zimbabwe | 100.0 /100 | #40 | Exceptional 8.0% |
| Iranians | 100.0 /100 | #41 | Exceptional 8.0% |
| Immigrants | Somalia | 100.0 /100 | #42 | Exceptional 8.0% |
| Bhutanese | 100.0 /100 | #43 | Exceptional 8.1% |
| Immigrants | Sweden | 100.0 /100 | #44 | Exceptional 8.1% |
| Immigrants | Bulgaria | 100.0 /100 | #45 | Exceptional 8.1% |