Immigrants from Latvia vs Fijian Male Unemployment
COMPARE
Immigrants from Latvia
Fijian
Male Unemployment
Male Unemployment Comparison
Immigrants from Latvia
Fijians
5.1%
MALE UNEMPLOYMENT
87.5/ 100
METRIC RATING
124th/ 347
METRIC RANK
5.2%
MALE UNEMPLOYMENT
78.3/ 100
METRIC RATING
142nd/ 347
METRIC RANK
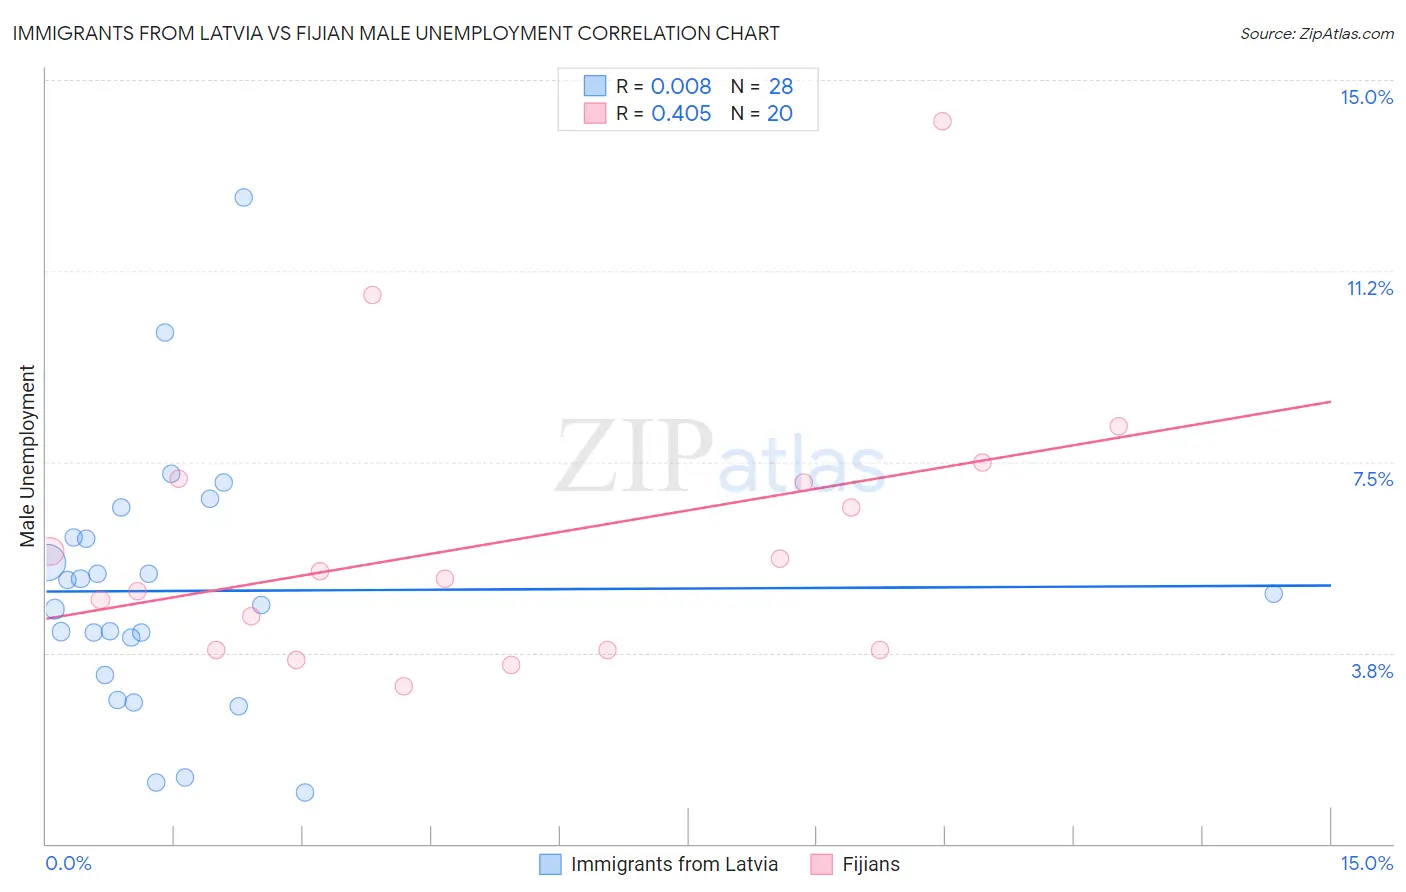
Immigrants from Latvia vs Fijian Male Unemployment Correlation Chart
The statistical analysis conducted on geographies consisting of 113,659,649 people shows no correlation between the proportion of Immigrants from Latvia and unemployment rate among males in the United States with a correlation coefficient (R) of 0.008 and weighted average of 5.1%. Similarly, the statistical analysis conducted on geographies consisting of 55,914,259 people shows a moderate positive correlation between the proportion of Fijians and unemployment rate among males in the United States with a correlation coefficient (R) of 0.405 and weighted average of 5.2%, a difference of 1.0%.
Male Unemployment Correlation Summary
| Measurement | Immigrants from Latvia | Fijian |
| Minimum | 1.0% | 3.1% |
| Maximum | 12.7% | 14.2% |
| Range | 11.7% | 11.1% |
| Mean | 5.0% | 6.0% |
| Median | 4.8% | 5.3% |
| Interquartile 25% (IQ1) | 3.7% | 3.8% |
| Interquartile 75% (IQ3) | 6.0% | 7.1% |
| Interquartile Range (IQR) | 2.3% | 3.3% |
| Standard Deviation (Sample) | 2.5% | 2.7% |
| Standard Deviation (Population) | 2.5% | 2.7% |
Demographics Similar to Immigrants from Latvia and Fijians by Male Unemployment
In terms of male unemployment, the demographic groups most similar to Immigrants from Latvia are Palestinian (5.1%, a difference of 0.030%), Immigrants from Lithuania (5.1%, a difference of 0.040%), Immigrants from Colombia (5.1%, a difference of 0.10%), Immigrants from Brazil (5.2%, a difference of 0.15%), and Hungarian (5.2%, a difference of 0.30%). Similarly, the demographic groups most similar to Fijians are Syrian (5.2%, a difference of 0.030%), Immigrants from Switzerland (5.2%, a difference of 0.090%), Kenyan (5.2%, a difference of 0.10%), Brazilian (5.2%, a difference of 0.10%), and Immigrants from Croatia (5.2%, a difference of 0.13%).
| Demographics | Rating | Rank | Male Unemployment |
| Palestinians | 87.7 /100 | #123 | Excellent 5.1% |
| Immigrants | Latvia | 87.5 /100 | #124 | Excellent 5.1% |
| Immigrants | Lithuania | 87.2 /100 | #125 | Excellent 5.1% |
| Immigrants | Colombia | 86.8 /100 | #126 | Excellent 5.1% |
| Immigrants | Brazil | 86.3 /100 | #127 | Excellent 5.2% |
| Hungarians | 85.1 /100 | #128 | Excellent 5.2% |
| Immigrants | Western Europe | 84.8 /100 | #129 | Excellent 5.2% |
| Immigrants | Malaysia | 83.5 /100 | #130 | Excellent 5.2% |
| Immigrants | Germany | 83.0 /100 | #131 | Excellent 5.2% |
| Chickasaw | 82.9 /100 | #132 | Excellent 5.2% |
| Colombians | 81.1 /100 | #133 | Excellent 5.2% |
| Pakistanis | 80.5 /100 | #134 | Excellent 5.2% |
| Immigrants | Saudi Arabia | 80.1 /100 | #135 | Excellent 5.2% |
| Lebanese | 79.9 /100 | #136 | Good 5.2% |
| Immigrants | Eastern Africa | 79.8 /100 | #137 | Good 5.2% |
| Immigrants | Croatia | 79.7 /100 | #138 | Good 5.2% |
| Kenyans | 79.4 /100 | #139 | Good 5.2% |
| Brazilians | 79.3 /100 | #140 | Good 5.2% |
| Immigrants | Switzerland | 79.2 /100 | #141 | Good 5.2% |
| Fijians | 78.3 /100 | #142 | Good 5.2% |
| Syrians | 78.0 /100 | #143 | Good 5.2% |