Immigrants from Latvia vs Immigrants from Cambodia Male Unemployment
COMPARE
Immigrants from Latvia
Immigrants from Cambodia
Male Unemployment
Male Unemployment Comparison
Immigrants from Latvia
Immigrants from Cambodia
5.1%
MALE UNEMPLOYMENT
87.5/ 100
METRIC RATING
124th/ 347
METRIC RANK
5.6%
MALE UNEMPLOYMENT
1.8/ 100
METRIC RATING
226th/ 347
METRIC RANK
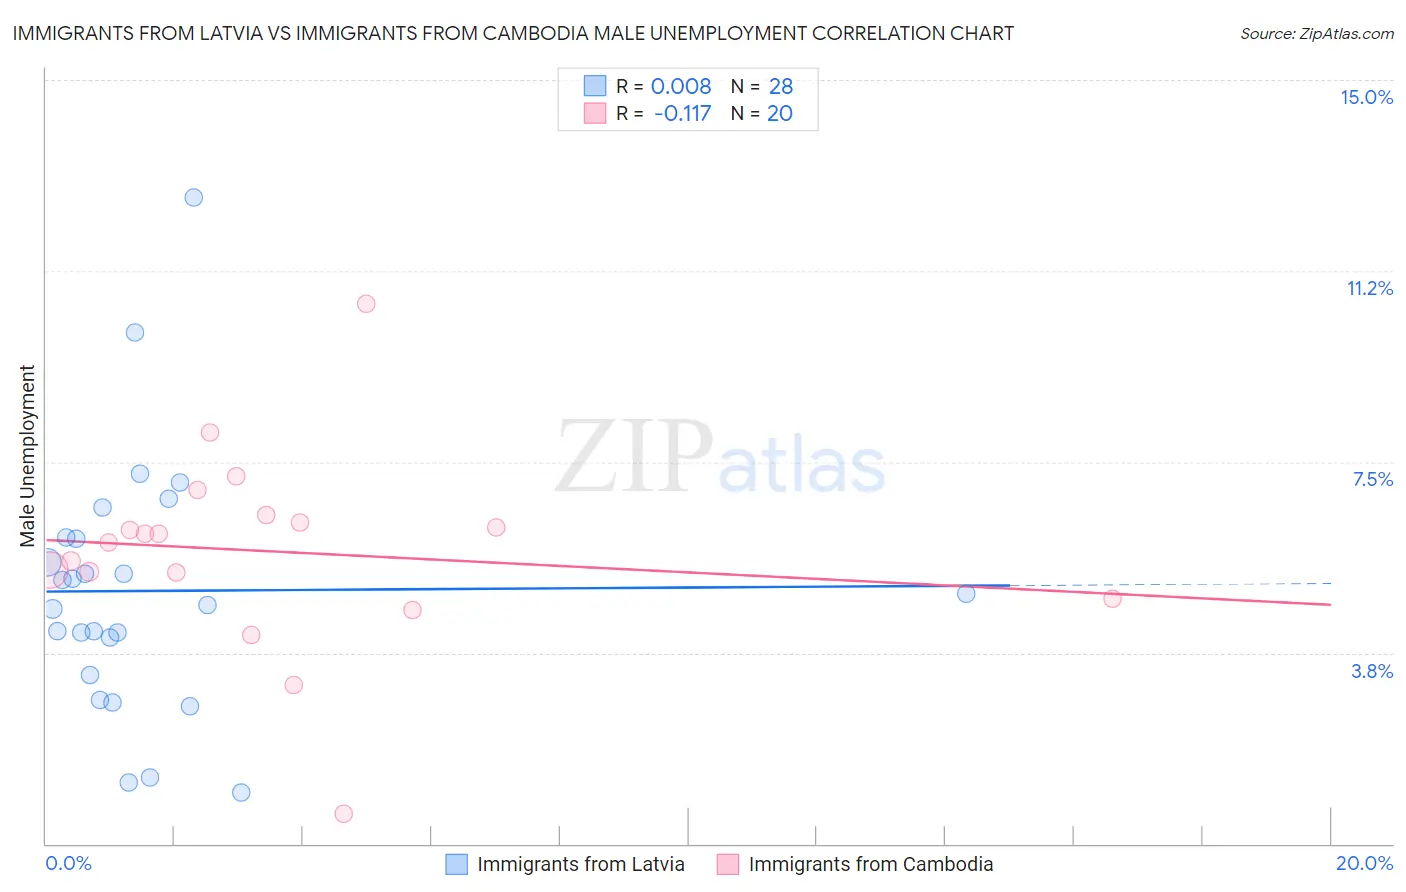
Immigrants from Latvia vs Immigrants from Cambodia Male Unemployment Correlation Chart
The statistical analysis conducted on geographies consisting of 113,659,649 people shows no correlation between the proportion of Immigrants from Latvia and unemployment rate among males in the United States with a correlation coefficient (R) of 0.008 and weighted average of 5.1%. Similarly, the statistical analysis conducted on geographies consisting of 204,980,262 people shows a poor negative correlation between the proportion of Immigrants from Cambodia and unemployment rate among males in the United States with a correlation coefficient (R) of -0.117 and weighted average of 5.6%, a difference of 8.9%.
Male Unemployment Correlation Summary
| Measurement | Immigrants from Latvia | Immigrants from Cambodia |
| Minimum | 1.0% | 0.60% |
| Maximum | 12.7% | 10.6% |
| Range | 11.7% | 10.0% |
| Mean | 5.0% | 5.7% |
| Median | 4.8% | 6.0% |
| Interquartile 25% (IQ1) | 3.7% | 5.1% |
| Interquartile 75% (IQ3) | 6.0% | 6.4% |
| Interquartile Range (IQR) | 2.3% | 1.3% |
| Standard Deviation (Sample) | 2.5% | 2.0% |
| Standard Deviation (Population) | 2.5% | 1.9% |
Similar Demographics by Male Unemployment
Demographics Similar to Immigrants from Latvia by Male Unemployment
In terms of male unemployment, the demographic groups most similar to Immigrants from Latvia are Palestinian (5.1%, a difference of 0.030%), Immigrants from Lithuania (5.1%, a difference of 0.040%), Nicaraguan (5.1%, a difference of 0.10%), Immigrants from Colombia (5.1%, a difference of 0.10%), and Ukrainian (5.1%, a difference of 0.13%).
| Demographics | Rating | Rank | Male Unemployment |
| Estonians | 89.0 /100 | #117 | Excellent 5.1% |
| Cypriots | 88.8 /100 | #118 | Excellent 5.1% |
| French Canadians | 88.6 /100 | #119 | Excellent 5.1% |
| Ukrainians | 88.4 /100 | #120 | Excellent 5.1% |
| Mongolians | 88.4 /100 | #121 | Excellent 5.1% |
| Nicaraguans | 88.2 /100 | #122 | Excellent 5.1% |
| Palestinians | 87.7 /100 | #123 | Excellent 5.1% |
| Immigrants | Latvia | 87.5 /100 | #124 | Excellent 5.1% |
| Immigrants | Lithuania | 87.2 /100 | #125 | Excellent 5.1% |
| Immigrants | Colombia | 86.8 /100 | #126 | Excellent 5.1% |
| Immigrants | Brazil | 86.3 /100 | #127 | Excellent 5.2% |
| Hungarians | 85.1 /100 | #128 | Excellent 5.2% |
| Immigrants | Western Europe | 84.8 /100 | #129 | Excellent 5.2% |
| Immigrants | Malaysia | 83.5 /100 | #130 | Excellent 5.2% |
| Immigrants | Germany | 83.0 /100 | #131 | Excellent 5.2% |
Demographics Similar to Immigrants from Cambodia by Male Unemployment
In terms of male unemployment, the demographic groups most similar to Immigrants from Cambodia are Immigrants from Panama (5.6%, a difference of 0.0%), Seminole (5.6%, a difference of 0.020%), Central American (5.6%, a difference of 0.030%), Immigrants from Africa (5.6%, a difference of 0.060%), and Panamanian (5.6%, a difference of 0.090%).
| Demographics | Rating | Rank | Male Unemployment |
| Immigrants | Western Asia | 3.5 /100 | #219 | Tragic 5.6% |
| Portuguese | 3.5 /100 | #220 | Tragic 5.6% |
| Soviet Union | 3.2 /100 | #221 | Tragic 5.6% |
| Immigrants | Micronesia | 2.9 /100 | #222 | Tragic 5.6% |
| Creek | 2.6 /100 | #223 | Tragic 5.6% |
| Cherokee | 2.4 /100 | #224 | Tragic 5.6% |
| Panamanians | 1.9 /100 | #225 | Tragic 5.6% |
| Immigrants | Cambodia | 1.8 /100 | #226 | Tragic 5.6% |
| Immigrants | Panama | 1.8 /100 | #227 | Tragic 5.6% |
| Seminole | 1.8 /100 | #228 | Tragic 5.6% |
| Central Americans | 1.8 /100 | #229 | Tragic 5.6% |
| Immigrants | Africa | 1.7 /100 | #230 | Tragic 5.6% |
| Choctaw | 1.6 /100 | #231 | Tragic 5.6% |
| Moroccans | 1.6 /100 | #232 | Tragic 5.6% |
| Somalis | 1.5 /100 | #233 | Tragic 5.6% |