Immigrants from Singapore vs Chilean Unemployment
COMPARE
Immigrants from Singapore
Chilean
Unemployment
Unemployment Comparison
Immigrants from Singapore
Chileans
4.9%
UNEMPLOYMENT
99.1/ 100
METRIC RATING
57th/ 347
METRIC RANK
5.0%
UNEMPLOYMENT
93.2/ 100
METRIC RATING
111th/ 347
METRIC RANK
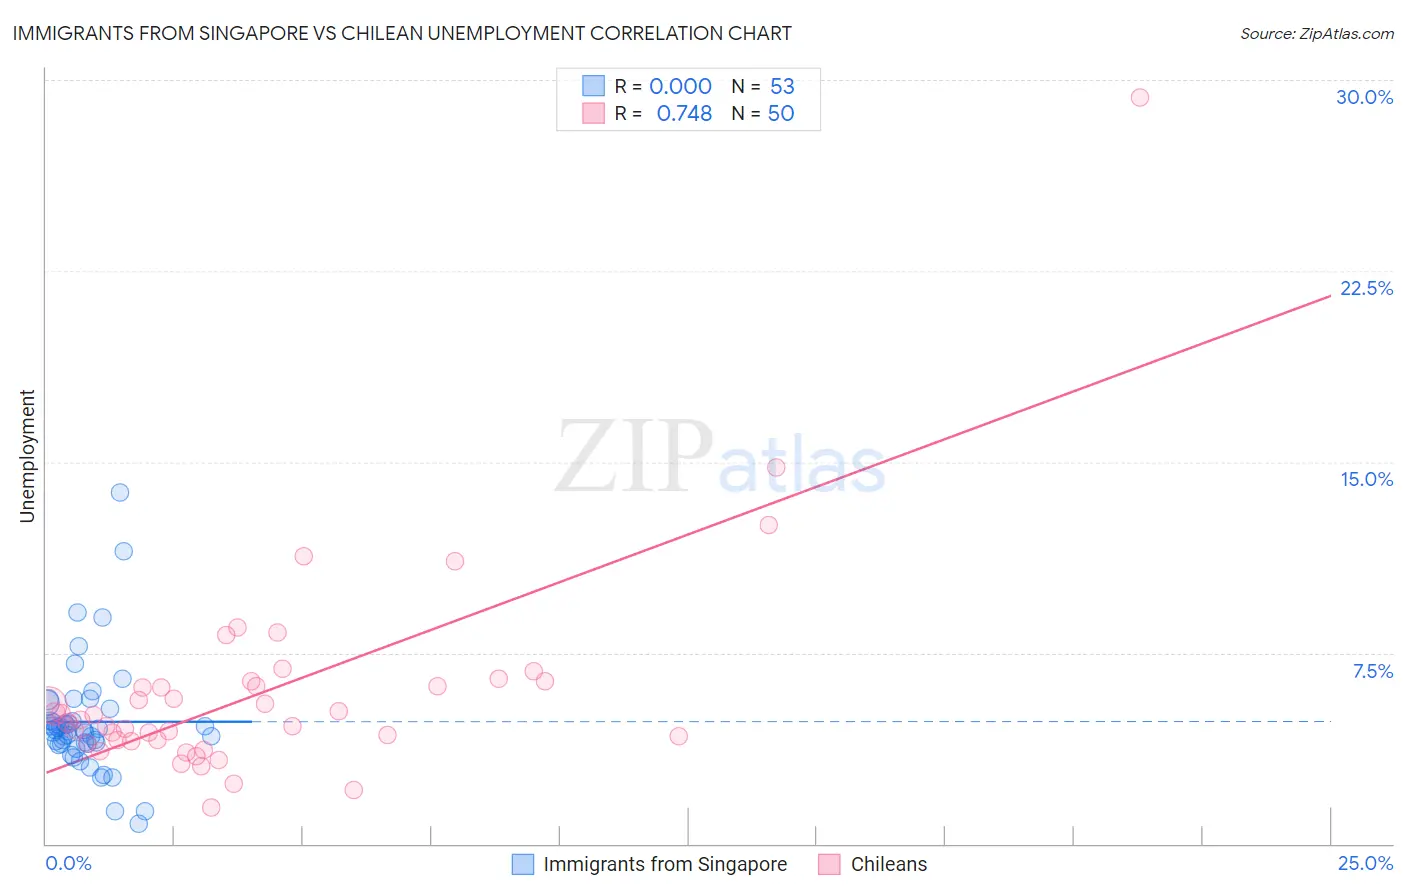
Immigrants from Singapore vs Chilean Unemployment Correlation Chart
The statistical analysis conducted on geographies consisting of 137,508,284 people shows no correlation between the proportion of Immigrants from Singapore and unemployment in the United States with a correlation coefficient (R) of 0.000 and weighted average of 4.9%. Similarly, the statistical analysis conducted on geographies consisting of 256,557,466 people shows a strong positive correlation between the proportion of Chileans and unemployment in the United States with a correlation coefficient (R) of 0.748 and weighted average of 5.0%, a difference of 3.4%.
Unemployment Correlation Summary
| Measurement | Immigrants from Singapore | Chilean |
| Minimum | 0.80% | 1.4% |
| Maximum | 13.8% | 29.3% |
| Range | 13.0% | 27.9% |
| Mean | 4.8% | 6.0% |
| Median | 4.5% | 5.0% |
| Interquartile 25% (IQ1) | 3.9% | 4.1% |
| Interquartile 75% (IQ3) | 5.1% | 6.4% |
| Interquartile Range (IQR) | 1.1% | 2.3% |
| Standard Deviation (Sample) | 2.2% | 4.2% |
| Standard Deviation (Population) | 2.2% | 4.2% |
Similar Demographics by Unemployment
Demographics Similar to Immigrants from Singapore by Unemployment
In terms of unemployment, the demographic groups most similar to Immigrants from Singapore are Celtic (4.9%, a difference of 0.070%), Greek (4.9%, a difference of 0.10%), Bhutanese (4.9%, a difference of 0.13%), Immigrants from Netherlands (4.9%, a difference of 0.17%), and Cambodian (4.9%, a difference of 0.17%).
| Demographics | Rating | Rank | Unemployment |
| French Canadians | 99.3 /100 | #50 | Exceptional 4.9% |
| Immigrants | Belgium | 99.2 /100 | #51 | Exceptional 4.9% |
| Whites/Caucasians | 99.2 /100 | #52 | Exceptional 4.9% |
| Immigrants | Zimbabwe | 99.2 /100 | #53 | Exceptional 4.9% |
| Eastern Europeans | 99.2 /100 | #54 | Exceptional 4.9% |
| Australians | 99.2 /100 | #55 | Exceptional 4.9% |
| Celtics | 99.1 /100 | #56 | Exceptional 4.9% |
| Immigrants | Singapore | 99.1 /100 | #57 | Exceptional 4.9% |
| Greeks | 99.0 /100 | #58 | Exceptional 4.9% |
| Bhutanese | 99.0 /100 | #59 | Exceptional 4.9% |
| Immigrants | Netherlands | 99.0 /100 | #60 | Exceptional 4.9% |
| Cambodians | 99.0 /100 | #61 | Exceptional 4.9% |
| Icelanders | 98.9 /100 | #62 | Exceptional 4.9% |
| Immigrants | Bulgaria | 98.9 /100 | #63 | Exceptional 4.9% |
| Italians | 98.9 /100 | #64 | Exceptional 4.9% |
Demographics Similar to Chileans by Unemployment
In terms of unemployment, the demographic groups most similar to Chileans are Immigrants from Lithuania (5.0%, a difference of 0.0%), Immigrants from Eritrea (5.0%, a difference of 0.020%), Immigrants from Kuwait (5.0%, a difference of 0.12%), Immigrants from Turkey (5.0%, a difference of 0.13%), and Immigrants from Romania (5.0%, a difference of 0.14%).
| Demographics | Rating | Rank | Unemployment |
| Osage | 94.0 /100 | #104 | Exceptional 5.0% |
| Maltese | 94.0 /100 | #105 | Exceptional 5.0% |
| Immigrants | Romania | 93.7 /100 | #106 | Exceptional 5.0% |
| Immigrants | Turkey | 93.7 /100 | #107 | Exceptional 5.0% |
| Immigrants | Kuwait | 93.7 /100 | #108 | Exceptional 5.0% |
| Immigrants | Eritrea | 93.3 /100 | #109 | Exceptional 5.0% |
| Immigrants | Lithuania | 93.2 /100 | #110 | Exceptional 5.0% |
| Chileans | 93.2 /100 | #111 | Exceptional 5.0% |
| South Africans | 92.6 /100 | #112 | Exceptional 5.1% |
| Argentineans | 92.4 /100 | #113 | Exceptional 5.1% |
| Immigrants | Ireland | 92.1 /100 | #114 | Exceptional 5.1% |
| Immigrants | Western Europe | 91.1 /100 | #115 | Exceptional 5.1% |
| Immigrants | Sri Lanka | 91.1 /100 | #116 | Exceptional 5.1% |
| Immigrants | Malaysia | 91.0 /100 | #117 | Exceptional 5.1% |
| Immigrants | Germany | 90.8 /100 | #118 | Exceptional 5.1% |