Immigrants from Jamaica vs Brazilian Male Unemployment
COMPARE
Immigrants from Jamaica
Brazilian
Male Unemployment
Male Unemployment Comparison
Immigrants from Jamaica
Brazilians
6.7%
MALE UNEMPLOYMENT
0.0/ 100
METRIC RATING
307th/ 347
METRIC RANK
5.2%
MALE UNEMPLOYMENT
79.3/ 100
METRIC RATING
140th/ 347
METRIC RANK
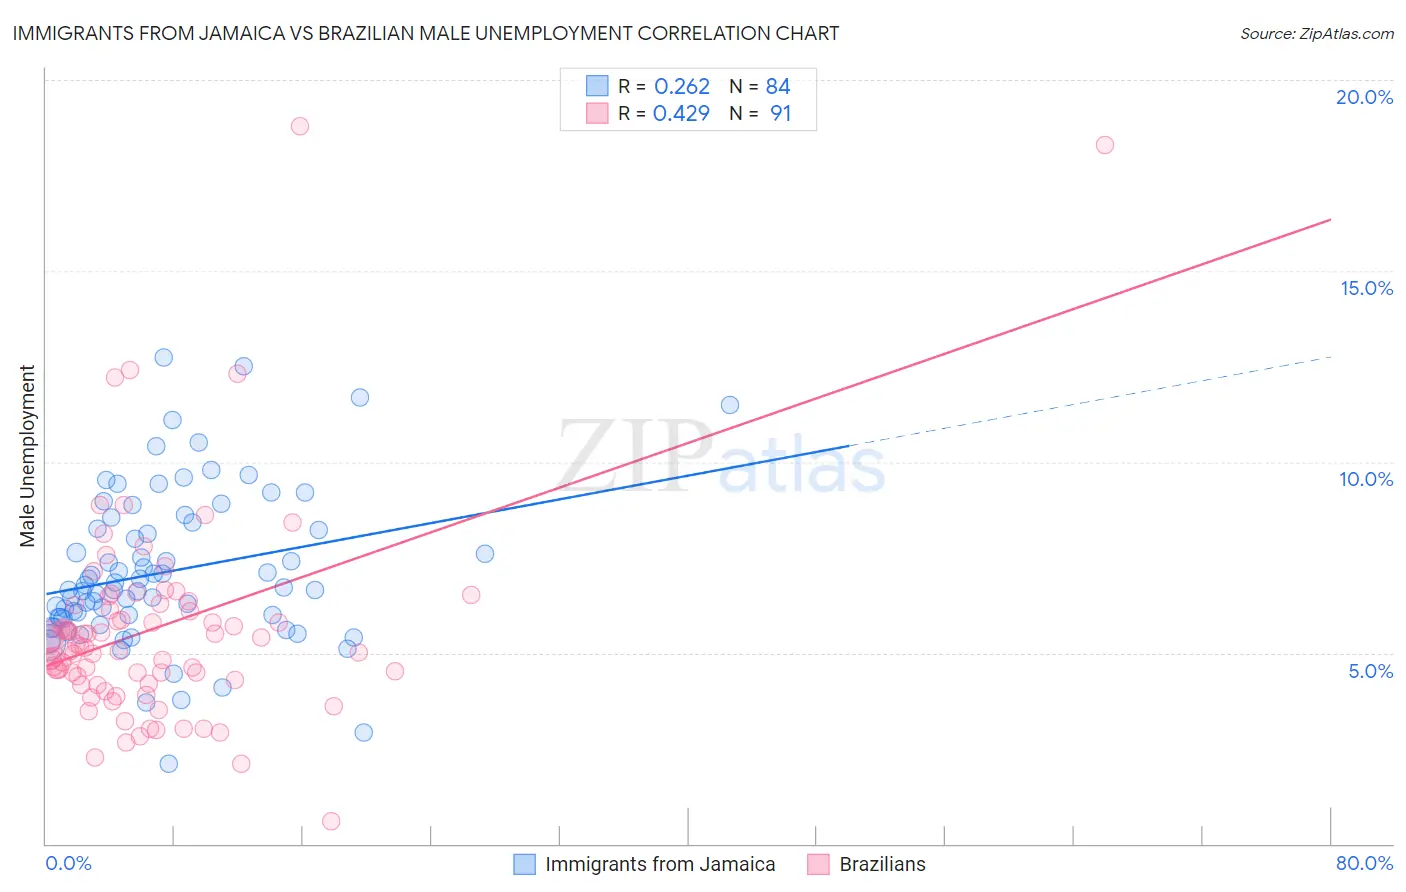
Immigrants from Jamaica vs Brazilian Male Unemployment Correlation Chart
The statistical analysis conducted on geographies consisting of 300,907,129 people shows a weak positive correlation between the proportion of Immigrants from Jamaica and unemployment rate among males in the United States with a correlation coefficient (R) of 0.262 and weighted average of 6.7%. Similarly, the statistical analysis conducted on geographies consisting of 323,069,083 people shows a moderate positive correlation between the proportion of Brazilians and unemployment rate among males in the United States with a correlation coefficient (R) of 0.429 and weighted average of 5.2%, a difference of 29.1%.
Male Unemployment Correlation Summary
| Measurement | Immigrants from Jamaica | Brazilian |
| Minimum | 2.1% | 0.60% |
| Maximum | 12.7% | 18.8% |
| Range | 10.6% | 18.2% |
| Mean | 7.1% | 5.6% |
| Median | 6.7% | 5.2% |
| Interquartile 25% (IQ1) | 5.9% | 4.3% |
| Interquartile 75% (IQ3) | 8.3% | 6.3% |
| Interquartile Range (IQR) | 2.4% | 2.0% |
| Standard Deviation (Sample) | 2.0% | 2.8% |
| Standard Deviation (Population) | 2.0% | 2.8% |
Similar Demographics by Male Unemployment
Demographics Similar to Immigrants from Jamaica by Male Unemployment
In terms of male unemployment, the demographic groups most similar to Immigrants from Jamaica are Immigrants from Trinidad and Tobago (6.7%, a difference of 0.080%), Trinidadian and Tobagonian (6.7%, a difference of 0.28%), Immigrants from West Indies (6.7%, a difference of 0.60%), West Indian (6.7%, a difference of 0.60%), and Ute (6.6%, a difference of 0.97%).
| Demographics | Rating | Rank | Male Unemployment |
| Vietnamese | 0.0 /100 | #300 | Tragic 6.6% |
| Immigrants | Belize | 0.0 /100 | #301 | Tragic 6.6% |
| Ute | 0.0 /100 | #302 | Tragic 6.6% |
| Immigrants | West Indies | 0.0 /100 | #303 | Tragic 6.7% |
| West Indians | 0.0 /100 | #304 | Tragic 6.7% |
| Trinidadians and Tobagonians | 0.0 /100 | #305 | Tragic 6.7% |
| Immigrants | Trinidad and Tobago | 0.0 /100 | #306 | Tragic 6.7% |
| Immigrants | Jamaica | 0.0 /100 | #307 | Tragic 6.7% |
| Aleuts | 0.0 /100 | #308 | Tragic 6.8% |
| Barbadians | 0.0 /100 | #309 | Tragic 6.9% |
| Blacks/African Americans | 0.0 /100 | #310 | Tragic 6.9% |
| Immigrants | Armenia | 0.0 /100 | #311 | Tragic 6.9% |
| Lumbee | 0.0 /100 | #312 | Tragic 6.9% |
| Immigrants | Dominica | 0.0 /100 | #313 | Tragic 7.0% |
| Immigrants | Barbados | 0.0 /100 | #314 | Tragic 7.1% |
Demographics Similar to Brazilians by Male Unemployment
In terms of male unemployment, the demographic groups most similar to Brazilians are Kenyan (5.2%, a difference of 0.010%), Immigrants from Switzerland (5.2%, a difference of 0.010%), Immigrants from Croatia (5.2%, a difference of 0.030%), Immigrants from Eastern Africa (5.2%, a difference of 0.040%), and Lebanese (5.2%, a difference of 0.050%).
| Demographics | Rating | Rank | Male Unemployment |
| Colombians | 81.1 /100 | #133 | Excellent 5.2% |
| Pakistanis | 80.5 /100 | #134 | Excellent 5.2% |
| Immigrants | Saudi Arabia | 80.1 /100 | #135 | Excellent 5.2% |
| Lebanese | 79.9 /100 | #136 | Good 5.2% |
| Immigrants | Eastern Africa | 79.8 /100 | #137 | Good 5.2% |
| Immigrants | Croatia | 79.7 /100 | #138 | Good 5.2% |
| Kenyans | 79.4 /100 | #139 | Good 5.2% |
| Brazilians | 79.3 /100 | #140 | Good 5.2% |
| Immigrants | Switzerland | 79.2 /100 | #141 | Good 5.2% |
| Fijians | 78.3 /100 | #142 | Good 5.2% |
| Syrians | 78.0 /100 | #143 | Good 5.2% |
| Sri Lankans | 77.9 /100 | #144 | Good 5.2% |
| Macedonians | 77.7 /100 | #145 | Good 5.2% |
| Immigrants | Kenya | 77.6 /100 | #146 | Good 5.2% |
| Immigrants | Burma/Myanmar | 77.5 /100 | #147 | Good 5.2% |