Immigrants from Moldova vs Brazilian Male Unemployment
COMPARE
Immigrants from Moldova
Brazilian
Male Unemployment
Male Unemployment Comparison
Immigrants from Moldova
Brazilians
5.1%
MALE UNEMPLOYMENT
90.3/ 100
METRIC RATING
112th/ 347
METRIC RANK
5.2%
MALE UNEMPLOYMENT
79.3/ 100
METRIC RATING
140th/ 347
METRIC RANK
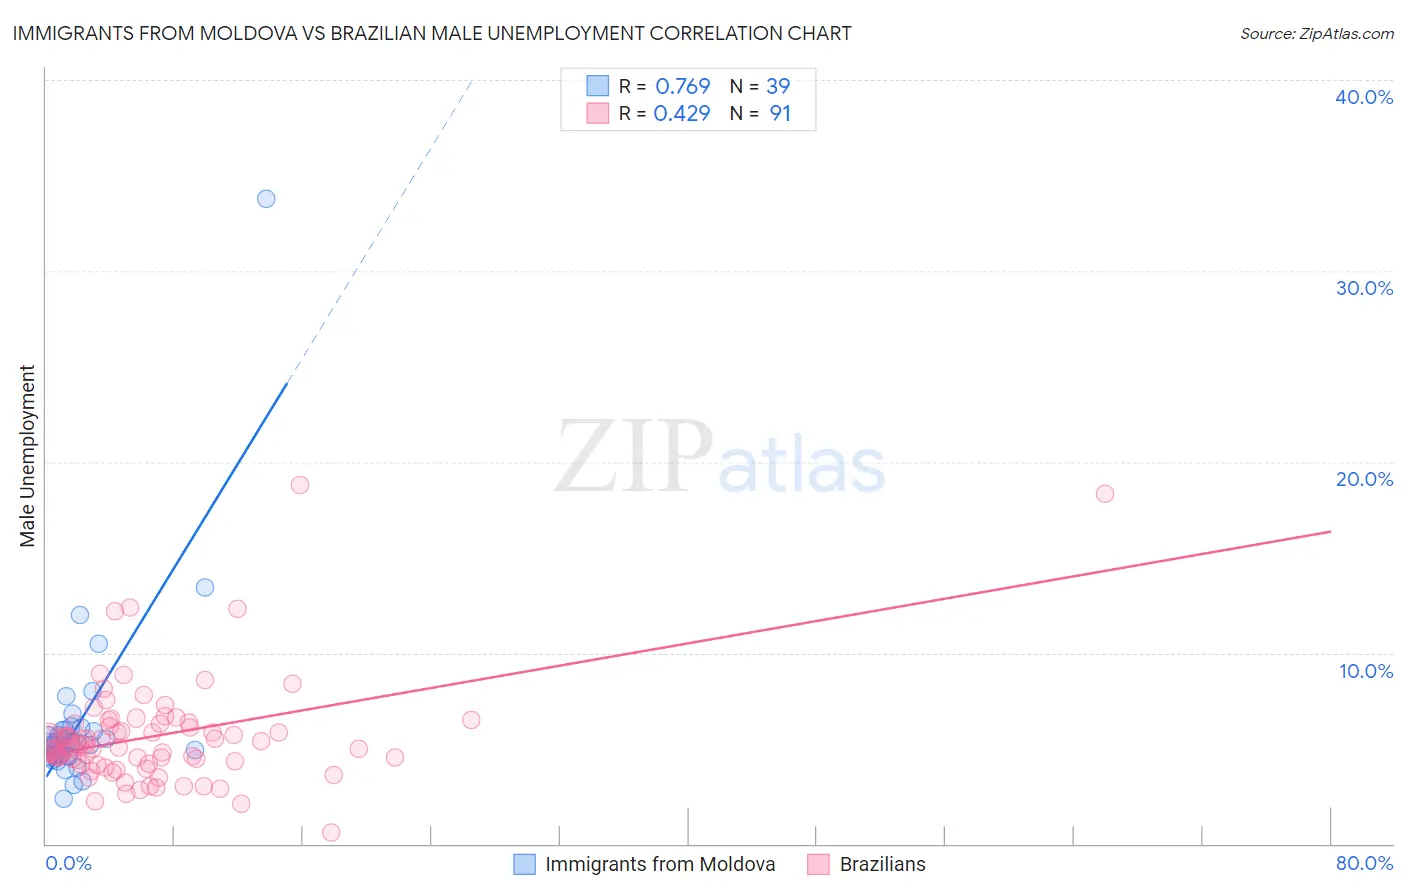
Immigrants from Moldova vs Brazilian Male Unemployment Correlation Chart
The statistical analysis conducted on geographies consisting of 124,231,836 people shows a strong positive correlation between the proportion of Immigrants from Moldova and unemployment rate among males in the United States with a correlation coefficient (R) of 0.769 and weighted average of 5.1%. Similarly, the statistical analysis conducted on geographies consisting of 323,069,083 people shows a moderate positive correlation between the proportion of Brazilians and unemployment rate among males in the United States with a correlation coefficient (R) of 0.429 and weighted average of 5.2%, a difference of 1.3%.
Male Unemployment Correlation Summary
| Measurement | Immigrants from Moldova | Brazilian |
| Minimum | 2.4% | 0.60% |
| Maximum | 33.8% | 18.8% |
| Range | 31.4% | 18.2% |
| Mean | 6.4% | 5.6% |
| Median | 5.3% | 5.2% |
| Interquartile 25% (IQ1) | 4.6% | 4.3% |
| Interquartile 75% (IQ3) | 6.0% | 6.3% |
| Interquartile Range (IQR) | 1.4% | 2.0% |
| Standard Deviation (Sample) | 5.0% | 2.8% |
| Standard Deviation (Population) | 4.9% | 2.8% |
Similar Demographics by Male Unemployment
Demographics Similar to Immigrants from Moldova by Male Unemployment
In terms of male unemployment, the demographic groups most similar to Immigrants from Moldova are Immigrants from Austria (5.1%, a difference of 0.010%), Immigrants from Eastern Asia (5.1%, a difference of 0.080%), Romanian (5.1%, a difference of 0.080%), Immigrants from England (5.1%, a difference of 0.090%), and Immigrants from Pakistan (5.1%, a difference of 0.11%).
| Demographics | Rating | Rank | Male Unemployment |
| Immigrants | Czechoslovakia | 91.7 /100 | #105 | Exceptional 5.1% |
| Immigrants | Ethiopia | 91.5 /100 | #106 | Exceptional 5.1% |
| Ethiopians | 91.3 /100 | #107 | Exceptional 5.1% |
| Immigrants | Nicaragua | 91.2 /100 | #108 | Exceptional 5.1% |
| Immigrants | Pakistan | 90.9 /100 | #109 | Exceptional 5.1% |
| Immigrants | England | 90.8 /100 | #110 | Exceptional 5.1% |
| Immigrants | Eastern Asia | 90.8 /100 | #111 | Exceptional 5.1% |
| Immigrants | Moldova | 90.3 /100 | #112 | Exceptional 5.1% |
| Immigrants | Austria | 90.3 /100 | #113 | Exceptional 5.1% |
| Romanians | 89.8 /100 | #114 | Excellent 5.1% |
| Immigrants | Asia | 89.6 /100 | #115 | Excellent 5.1% |
| Immigrants | Denmark | 89.4 /100 | #116 | Excellent 5.1% |
| Estonians | 89.0 /100 | #117 | Excellent 5.1% |
| Cypriots | 88.8 /100 | #118 | Excellent 5.1% |
| French Canadians | 88.6 /100 | #119 | Excellent 5.1% |
Demographics Similar to Brazilians by Male Unemployment
In terms of male unemployment, the demographic groups most similar to Brazilians are Kenyan (5.2%, a difference of 0.010%), Immigrants from Switzerland (5.2%, a difference of 0.010%), Immigrants from Croatia (5.2%, a difference of 0.030%), Immigrants from Eastern Africa (5.2%, a difference of 0.040%), and Lebanese (5.2%, a difference of 0.050%).
| Demographics | Rating | Rank | Male Unemployment |
| Colombians | 81.1 /100 | #133 | Excellent 5.2% |
| Pakistanis | 80.5 /100 | #134 | Excellent 5.2% |
| Immigrants | Saudi Arabia | 80.1 /100 | #135 | Excellent 5.2% |
| Lebanese | 79.9 /100 | #136 | Good 5.2% |
| Immigrants | Eastern Africa | 79.8 /100 | #137 | Good 5.2% |
| Immigrants | Croatia | 79.7 /100 | #138 | Good 5.2% |
| Kenyans | 79.4 /100 | #139 | Good 5.2% |
| Brazilians | 79.3 /100 | #140 | Good 5.2% |
| Immigrants | Switzerland | 79.2 /100 | #141 | Good 5.2% |
| Fijians | 78.3 /100 | #142 | Good 5.2% |
| Syrians | 78.0 /100 | #143 | Good 5.2% |
| Sri Lankans | 77.9 /100 | #144 | Good 5.2% |
| Macedonians | 77.7 /100 | #145 | Good 5.2% |
| Immigrants | Kenya | 77.6 /100 | #146 | Good 5.2% |
| Immigrants | Burma/Myanmar | 77.5 /100 | #147 | Good 5.2% |