Immigrants from Jamaica vs Portuguese Male Unemployment
COMPARE
Immigrants from Jamaica
Portuguese
Male Unemployment
Male Unemployment Comparison
Immigrants from Jamaica
Portuguese
6.7%
MALE UNEMPLOYMENT
0.0/ 100
METRIC RATING
307th/ 347
METRIC RANK
5.6%
MALE UNEMPLOYMENT
3.5/ 100
METRIC RATING
220th/ 347
METRIC RANK
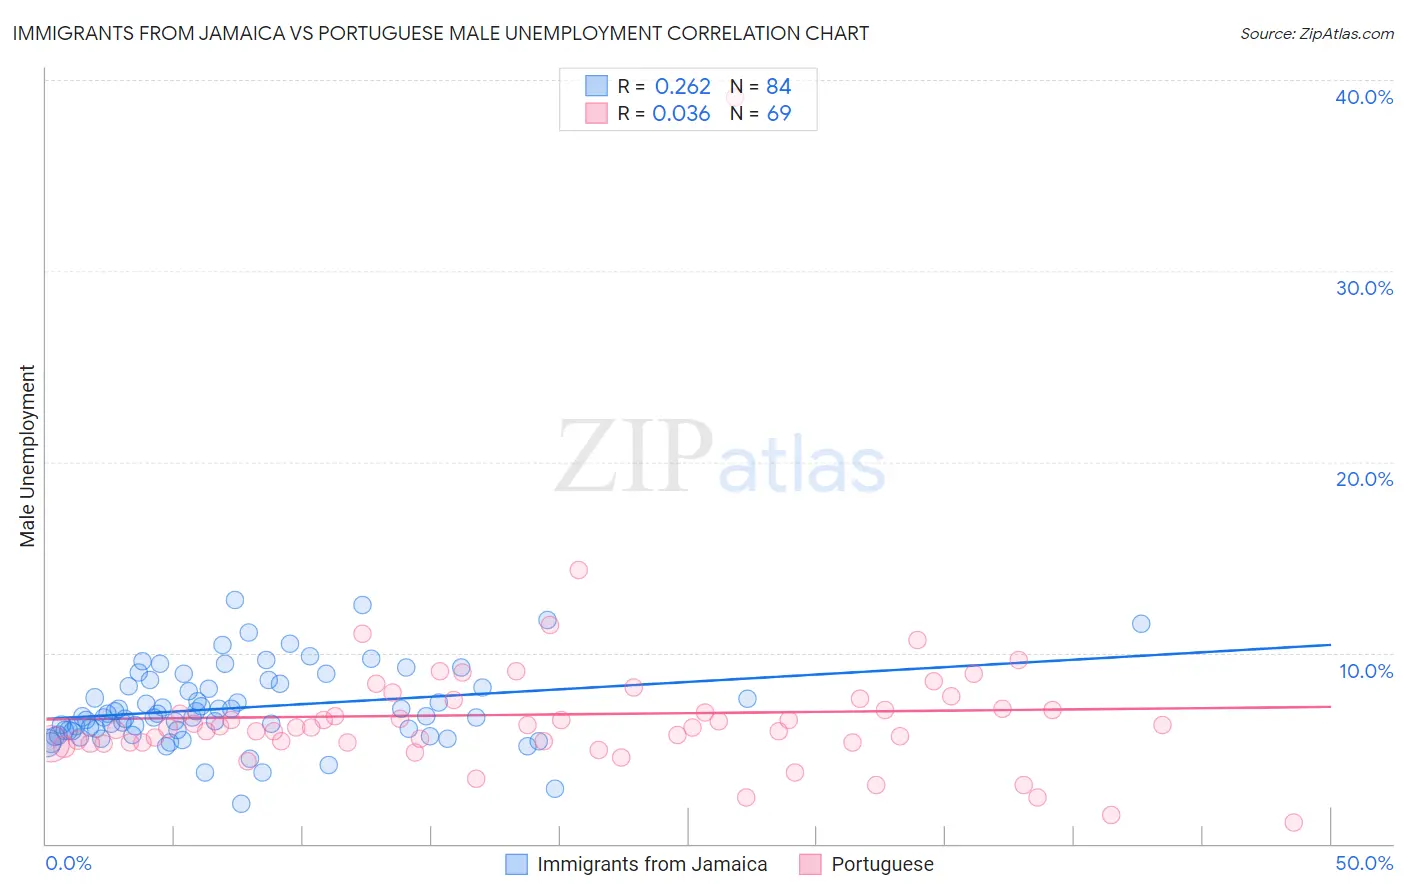
Immigrants from Jamaica vs Portuguese Male Unemployment Correlation Chart
The statistical analysis conducted on geographies consisting of 300,907,129 people shows a weak positive correlation between the proportion of Immigrants from Jamaica and unemployment rate among males in the United States with a correlation coefficient (R) of 0.262 and weighted average of 6.7%. Similarly, the statistical analysis conducted on geographies consisting of 447,471,773 people shows no correlation between the proportion of Portuguese and unemployment rate among males in the United States with a correlation coefficient (R) of 0.036 and weighted average of 5.6%, a difference of 20.7%.
Male Unemployment Correlation Summary
| Measurement | Immigrants from Jamaica | Portuguese |
| Minimum | 2.1% | 1.1% |
| Maximum | 12.7% | 39.1% |
| Range | 10.6% | 38.0% |
| Mean | 7.1% | 6.8% |
| Median | 6.7% | 6.1% |
| Interquartile 25% (IQ1) | 5.9% | 5.3% |
| Interquartile 75% (IQ3) | 8.3% | 7.3% |
| Interquartile Range (IQR) | 2.4% | 2.0% |
| Standard Deviation (Sample) | 2.0% | 4.5% |
| Standard Deviation (Population) | 2.0% | 4.5% |
Similar Demographics by Male Unemployment
Demographics Similar to Immigrants from Jamaica by Male Unemployment
In terms of male unemployment, the demographic groups most similar to Immigrants from Jamaica are Immigrants from Trinidad and Tobago (6.7%, a difference of 0.080%), Trinidadian and Tobagonian (6.7%, a difference of 0.28%), Immigrants from West Indies (6.7%, a difference of 0.60%), West Indian (6.7%, a difference of 0.60%), and Ute (6.6%, a difference of 0.97%).
| Demographics | Rating | Rank | Male Unemployment |
| Vietnamese | 0.0 /100 | #300 | Tragic 6.6% |
| Immigrants | Belize | 0.0 /100 | #301 | Tragic 6.6% |
| Ute | 0.0 /100 | #302 | Tragic 6.6% |
| Immigrants | West Indies | 0.0 /100 | #303 | Tragic 6.7% |
| West Indians | 0.0 /100 | #304 | Tragic 6.7% |
| Trinidadians and Tobagonians | 0.0 /100 | #305 | Tragic 6.7% |
| Immigrants | Trinidad and Tobago | 0.0 /100 | #306 | Tragic 6.7% |
| Immigrants | Jamaica | 0.0 /100 | #307 | Tragic 6.7% |
| Aleuts | 0.0 /100 | #308 | Tragic 6.8% |
| Barbadians | 0.0 /100 | #309 | Tragic 6.9% |
| Blacks/African Americans | 0.0 /100 | #310 | Tragic 6.9% |
| Immigrants | Armenia | 0.0 /100 | #311 | Tragic 6.9% |
| Lumbee | 0.0 /100 | #312 | Tragic 6.9% |
| Immigrants | Dominica | 0.0 /100 | #313 | Tragic 7.0% |
| Immigrants | Barbados | 0.0 /100 | #314 | Tragic 7.1% |
Demographics Similar to Portuguese by Male Unemployment
In terms of male unemployment, the demographic groups most similar to Portuguese are Immigrants from Western Asia (5.6%, a difference of 0.030%), Immigrants from Albania (5.5%, a difference of 0.070%), Soviet Union (5.6%, a difference of 0.11%), Immigrants from Micronesia (5.6%, a difference of 0.25%), and Delaware (5.5%, a difference of 0.28%).
| Demographics | Rating | Rank | Male Unemployment |
| Ugandans | 6.3 /100 | #213 | Tragic 5.5% |
| Puget Sound Salish | 5.6 /100 | #214 | Tragic 5.5% |
| Samoans | 4.9 /100 | #215 | Tragic 5.5% |
| Immigrants | Immigrants | 4.3 /100 | #216 | Tragic 5.5% |
| Delaware | 4.2 /100 | #217 | Tragic 5.5% |
| Immigrants | Albania | 3.6 /100 | #218 | Tragic 5.5% |
| Immigrants | Western Asia | 3.5 /100 | #219 | Tragic 5.6% |
| Portuguese | 3.5 /100 | #220 | Tragic 5.6% |
| Soviet Union | 3.2 /100 | #221 | Tragic 5.6% |
| Immigrants | Micronesia | 2.9 /100 | #222 | Tragic 5.6% |
| Creek | 2.6 /100 | #223 | Tragic 5.6% |
| Cherokee | 2.4 /100 | #224 | Tragic 5.6% |
| Panamanians | 1.9 /100 | #225 | Tragic 5.6% |
| Immigrants | Cambodia | 1.8 /100 | #226 | Tragic 5.6% |
| Immigrants | Panama | 1.8 /100 | #227 | Tragic 5.6% |