Immigrants from Afghanistan vs Brazilian Male Unemployment
COMPARE
Immigrants from Afghanistan
Brazilian
Male Unemployment
Male Unemployment Comparison
Immigrants from Afghanistan
Brazilians
5.3%
MALE UNEMPLOYMENT
37.9/ 100
METRIC RATING
181st/ 347
METRIC RANK
5.2%
MALE UNEMPLOYMENT
79.3/ 100
METRIC RATING
140th/ 347
METRIC RANK
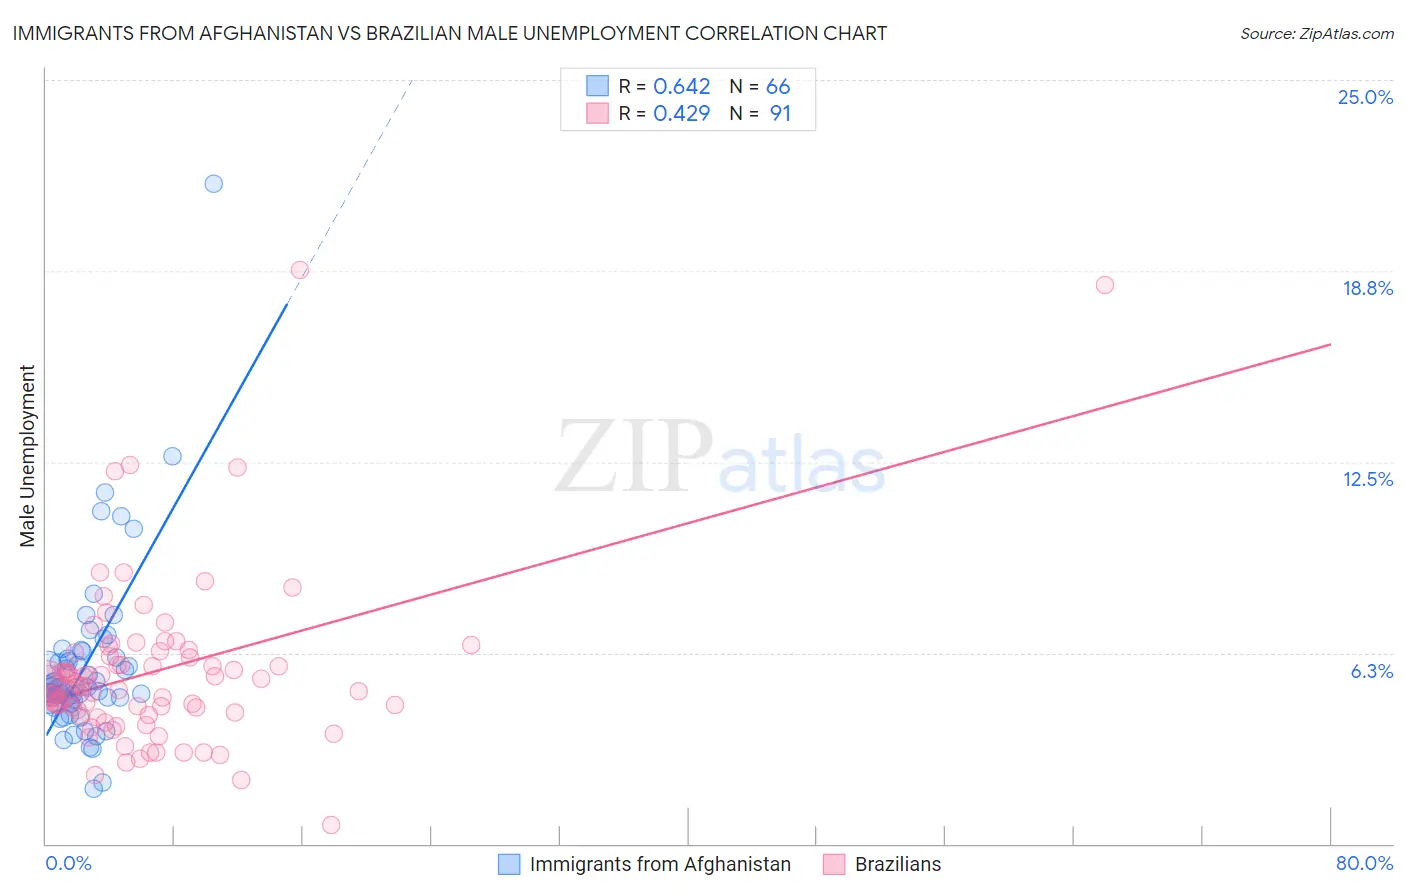
Immigrants from Afghanistan vs Brazilian Male Unemployment Correlation Chart
The statistical analysis conducted on geographies consisting of 147,586,191 people shows a significant positive correlation between the proportion of Immigrants from Afghanistan and unemployment rate among males in the United States with a correlation coefficient (R) of 0.642 and weighted average of 5.3%. Similarly, the statistical analysis conducted on geographies consisting of 323,069,083 people shows a moderate positive correlation between the proportion of Brazilians and unemployment rate among males in the United States with a correlation coefficient (R) of 0.429 and weighted average of 5.2%, a difference of 2.7%.
Male Unemployment Correlation Summary
| Measurement | Immigrants from Afghanistan | Brazilian |
| Minimum | 1.8% | 0.60% |
| Maximum | 21.6% | 18.8% |
| Range | 19.8% | 18.2% |
| Mean | 5.8% | 5.6% |
| Median | 5.1% | 5.2% |
| Interquartile 25% (IQ1) | 4.6% | 4.3% |
| Interquartile 75% (IQ3) | 6.0% | 6.3% |
| Interquartile Range (IQR) | 1.4% | 2.0% |
| Standard Deviation (Sample) | 2.8% | 2.8% |
| Standard Deviation (Population) | 2.8% | 2.8% |
Similar Demographics by Male Unemployment
Demographics Similar to Immigrants from Afghanistan by Male Unemployment
In terms of male unemployment, the demographic groups most similar to Immigrants from Afghanistan are Potawatomi (5.3%, a difference of 0.010%), Taiwanese (5.3%, a difference of 0.020%), Malaysian (5.3%, a difference of 0.10%), Immigrants from Oceania (5.3%, a difference of 0.18%), and Spaniard (5.3%, a difference of 0.18%).
| Demographics | Rating | Rank | Male Unemployment |
| Immigrants | Iran | 50.0 /100 | #174 | Average 5.3% |
| Immigrants | Iraq | 48.1 /100 | #175 | Average 5.3% |
| Immigrants | Poland | 46.0 /100 | #176 | Average 5.3% |
| Immigrants | Peru | 44.6 /100 | #177 | Average 5.3% |
| Osage | 42.5 /100 | #178 | Average 5.3% |
| Immigrants | Oceania | 40.8 /100 | #179 | Average 5.3% |
| Malaysians | 39.6 /100 | #180 | Fair 5.3% |
| Immigrants | Afghanistan | 37.9 /100 | #181 | Fair 5.3% |
| Potawatomi | 37.8 /100 | #182 | Fair 5.3% |
| Taiwanese | 37.6 /100 | #183 | Fair 5.3% |
| Spaniards | 35.1 /100 | #184 | Fair 5.3% |
| Koreans | 34.9 /100 | #185 | Fair 5.3% |
| Iraqis | 31.6 /100 | #186 | Fair 5.4% |
| Costa Ricans | 31.3 /100 | #187 | Fair 5.4% |
| Arabs | 30.2 /100 | #188 | Fair 5.4% |
Demographics Similar to Brazilians by Male Unemployment
In terms of male unemployment, the demographic groups most similar to Brazilians are Kenyan (5.2%, a difference of 0.010%), Immigrants from Switzerland (5.2%, a difference of 0.010%), Immigrants from Croatia (5.2%, a difference of 0.030%), Immigrants from Eastern Africa (5.2%, a difference of 0.040%), and Lebanese (5.2%, a difference of 0.050%).
| Demographics | Rating | Rank | Male Unemployment |
| Colombians | 81.1 /100 | #133 | Excellent 5.2% |
| Pakistanis | 80.5 /100 | #134 | Excellent 5.2% |
| Immigrants | Saudi Arabia | 80.1 /100 | #135 | Excellent 5.2% |
| Lebanese | 79.9 /100 | #136 | Good 5.2% |
| Immigrants | Eastern Africa | 79.8 /100 | #137 | Good 5.2% |
| Immigrants | Croatia | 79.7 /100 | #138 | Good 5.2% |
| Kenyans | 79.4 /100 | #139 | Good 5.2% |
| Brazilians | 79.3 /100 | #140 | Good 5.2% |
| Immigrants | Switzerland | 79.2 /100 | #141 | Good 5.2% |
| Fijians | 78.3 /100 | #142 | Good 5.2% |
| Syrians | 78.0 /100 | #143 | Good 5.2% |
| Sri Lankans | 77.9 /100 | #144 | Good 5.2% |
| Macedonians | 77.7 /100 | #145 | Good 5.2% |
| Immigrants | Kenya | 77.6 /100 | #146 | Good 5.2% |
| Immigrants | Burma/Myanmar | 77.5 /100 | #147 | Good 5.2% |