Immigrants from Jamaica vs Belizean Male Unemployment
COMPARE
Immigrants from Jamaica
Belizean
Male Unemployment
Male Unemployment Comparison
Immigrants from Jamaica
Belizeans
6.7%
MALE UNEMPLOYMENT
0.0/ 100
METRIC RATING
307th/ 347
METRIC RANK
6.5%
MALE UNEMPLOYMENT
0.0/ 100
METRIC RATING
295th/ 347
METRIC RANK
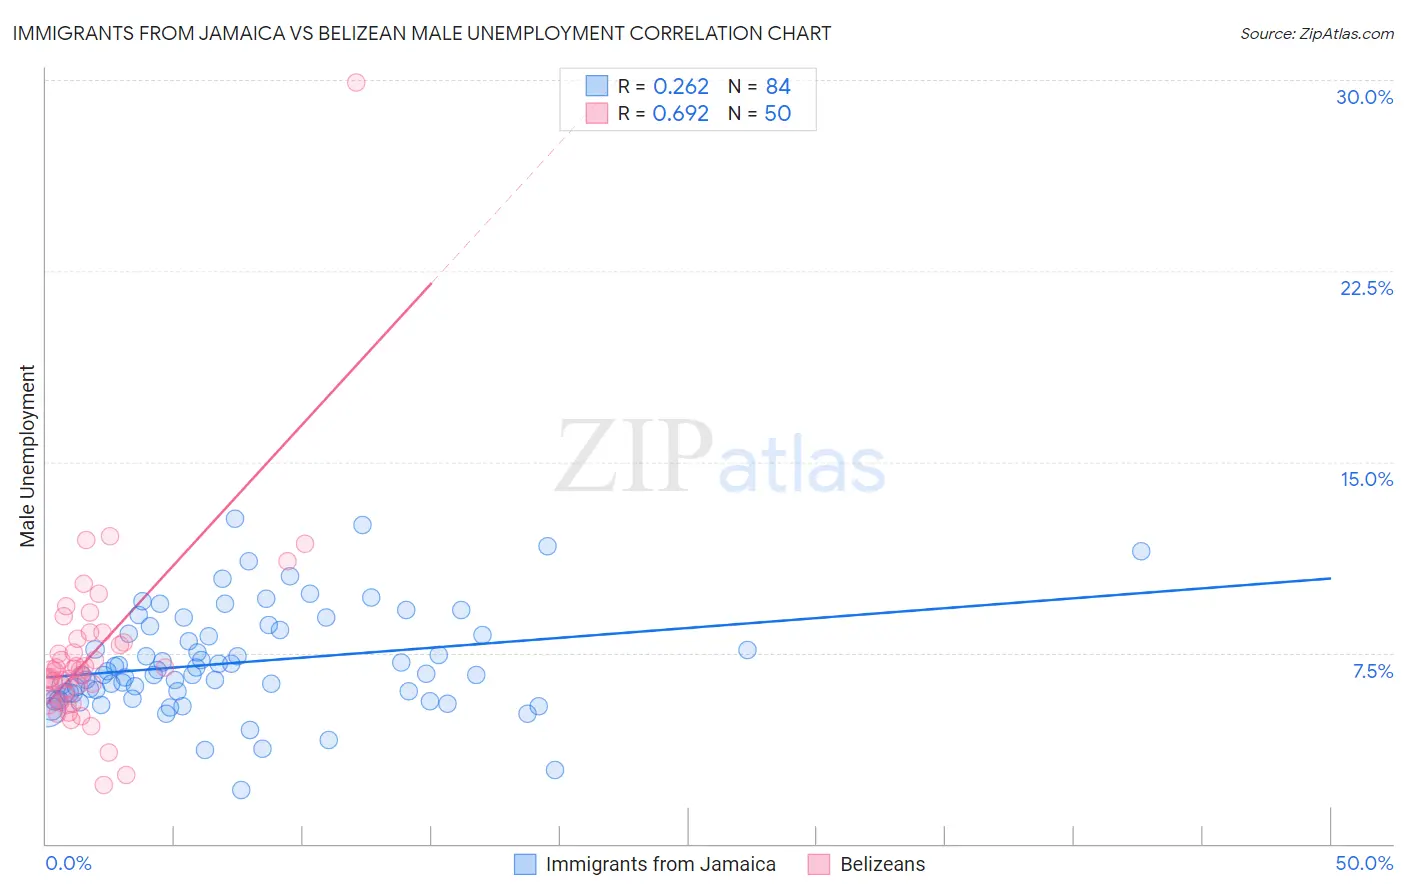
Immigrants from Jamaica vs Belizean Male Unemployment Correlation Chart
The statistical analysis conducted on geographies consisting of 300,907,129 people shows a weak positive correlation between the proportion of Immigrants from Jamaica and unemployment rate among males in the United States with a correlation coefficient (R) of 0.262 and weighted average of 6.7%. Similarly, the statistical analysis conducted on geographies consisting of 144,079,260 people shows a significant positive correlation between the proportion of Belizeans and unemployment rate among males in the United States with a correlation coefficient (R) of 0.692 and weighted average of 6.5%, a difference of 3.1%.
Male Unemployment Correlation Summary
| Measurement | Immigrants from Jamaica | Belizean |
| Minimum | 2.1% | 2.3% |
| Maximum | 12.7% | 29.9% |
| Range | 10.6% | 27.6% |
| Mean | 7.1% | 7.5% |
| Median | 6.7% | 6.8% |
| Interquartile 25% (IQ1) | 5.9% | 5.8% |
| Interquartile 75% (IQ3) | 8.3% | 8.1% |
| Interquartile Range (IQR) | 2.4% | 2.2% |
| Standard Deviation (Sample) | 2.0% | 3.9% |
| Standard Deviation (Population) | 2.0% | 3.8% |
Demographics Similar to Immigrants from Jamaica and Belizeans by Male Unemployment
In terms of male unemployment, the demographic groups most similar to Immigrants from Jamaica are Immigrants from Trinidad and Tobago (6.7%, a difference of 0.080%), Trinidadian and Tobagonian (6.7%, a difference of 0.28%), Immigrants from West Indies (6.7%, a difference of 0.60%), West Indian (6.7%, a difference of 0.60%), and Ute (6.6%, a difference of 0.97%). Similarly, the demographic groups most similar to Belizeans are Immigrants from Haiti (6.5%, a difference of 0.45%), Chippewa (6.6%, a difference of 0.77%), Senegalese (6.4%, a difference of 0.85%), Jamaican (6.6%, a difference of 0.85%), and Haitian (6.4%, a difference of 0.96%).
| Demographics | Rating | Rank | Male Unemployment |
| Immigrants | Azores | 0.0 /100 | #291 | Tragic 6.4% |
| Nepalese | 0.0 /100 | #292 | Tragic 6.4% |
| Haitians | 0.0 /100 | #293 | Tragic 6.4% |
| Senegalese | 0.0 /100 | #294 | Tragic 6.4% |
| Belizeans | 0.0 /100 | #295 | Tragic 6.5% |
| Immigrants | Haiti | 0.0 /100 | #296 | Tragic 6.5% |
| Chippewa | 0.0 /100 | #297 | Tragic 6.6% |
| Jamaicans | 0.0 /100 | #298 | Tragic 6.6% |
| Immigrants | Bangladesh | 0.0 /100 | #299 | Tragic 6.6% |
| Vietnamese | 0.0 /100 | #300 | Tragic 6.6% |
| Immigrants | Belize | 0.0 /100 | #301 | Tragic 6.6% |
| Ute | 0.0 /100 | #302 | Tragic 6.6% |
| Immigrants | West Indies | 0.0 /100 | #303 | Tragic 6.7% |
| West Indians | 0.0 /100 | #304 | Tragic 6.7% |
| Trinidadians and Tobagonians | 0.0 /100 | #305 | Tragic 6.7% |
| Immigrants | Trinidad and Tobago | 0.0 /100 | #306 | Tragic 6.7% |
| Immigrants | Jamaica | 0.0 /100 | #307 | Tragic 6.7% |
| Aleuts | 0.0 /100 | #308 | Tragic 6.8% |
| Barbadians | 0.0 /100 | #309 | Tragic 6.9% |
| Blacks/African Americans | 0.0 /100 | #310 | Tragic 6.9% |
| Immigrants | Armenia | 0.0 /100 | #311 | Tragic 6.9% |