Immigrants from Jamaica vs Immigrants from Western Europe Male Unemployment
COMPARE
Immigrants from Jamaica
Immigrants from Western Europe
Male Unemployment
Male Unemployment Comparison
Immigrants from Jamaica
Immigrants from Western Europe
6.7%
MALE UNEMPLOYMENT
0.0/ 100
METRIC RATING
307th/ 347
METRIC RANK
5.2%
MALE UNEMPLOYMENT
84.8/ 100
METRIC RATING
129th/ 347
METRIC RANK
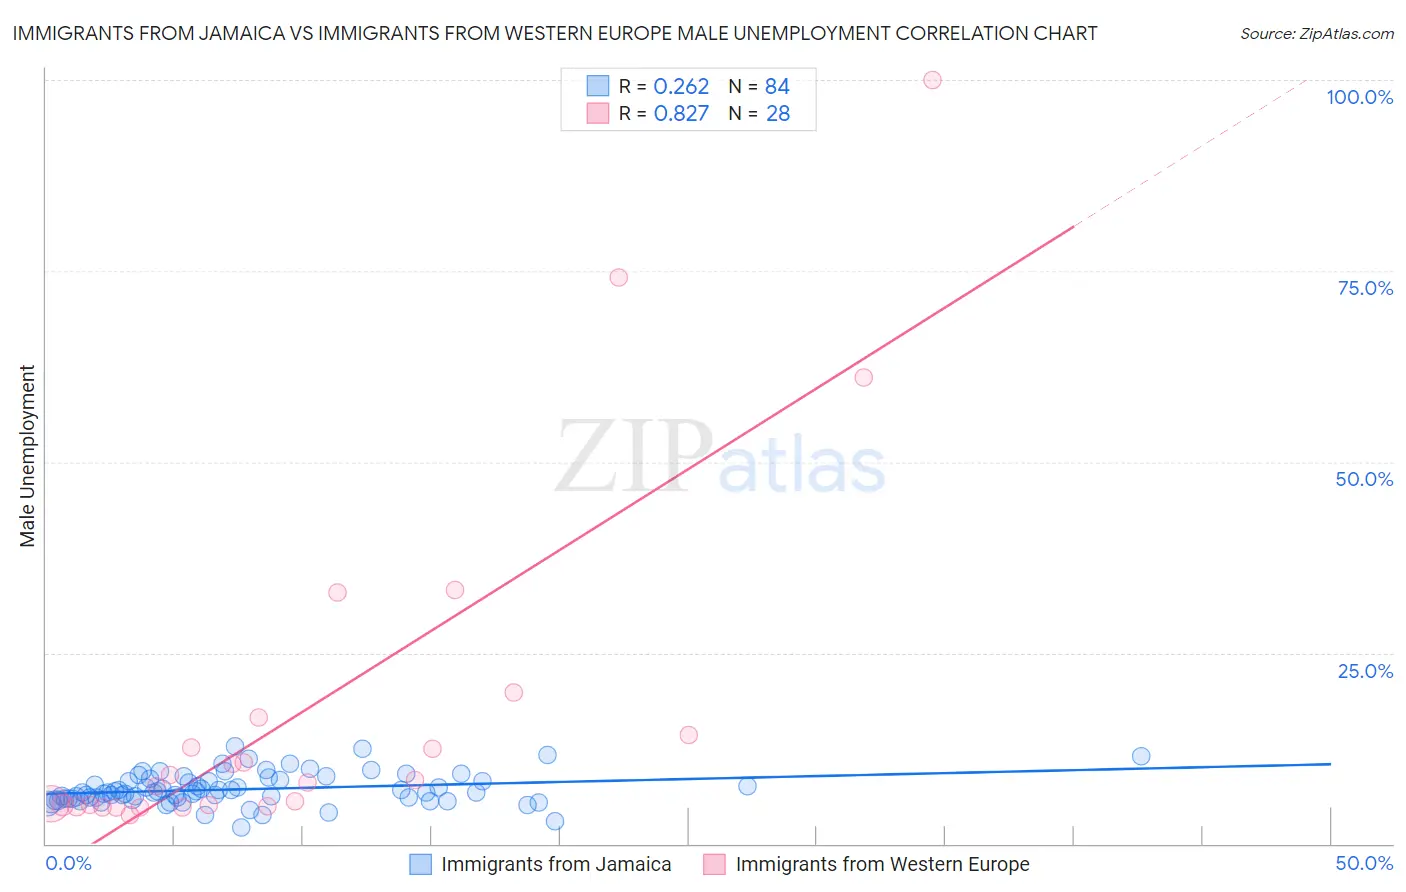
Immigrants from Jamaica vs Immigrants from Western Europe Male Unemployment Correlation Chart
The statistical analysis conducted on geographies consisting of 300,907,129 people shows a weak positive correlation between the proportion of Immigrants from Jamaica and unemployment rate among males in the United States with a correlation coefficient (R) of 0.262 and weighted average of 6.7%. Similarly, the statistical analysis conducted on geographies consisting of 490,157,705 people shows a very strong positive correlation between the proportion of Immigrants from Western Europe and unemployment rate among males in the United States with a correlation coefficient (R) of 0.827 and weighted average of 5.2%, a difference of 29.8%.
Male Unemployment Correlation Summary
| Measurement | Immigrants from Jamaica | Immigrants from Western Europe |
| Minimum | 2.1% | 3.8% |
| Maximum | 12.7% | 100.0% |
| Range | 10.6% | 96.2% |
| Mean | 7.1% | 17.5% |
| Median | 6.7% | 8.2% |
| Interquartile 25% (IQ1) | 5.9% | 4.9% |
| Interquartile 75% (IQ3) | 8.3% | 15.4% |
| Interquartile Range (IQR) | 2.4% | 10.4% |
| Standard Deviation (Sample) | 2.0% | 23.4% |
| Standard Deviation (Population) | 2.0% | 23.0% |
Similar Demographics by Male Unemployment
Demographics Similar to Immigrants from Jamaica by Male Unemployment
In terms of male unemployment, the demographic groups most similar to Immigrants from Jamaica are Immigrants from Trinidad and Tobago (6.7%, a difference of 0.080%), Trinidadian and Tobagonian (6.7%, a difference of 0.28%), Immigrants from West Indies (6.7%, a difference of 0.60%), West Indian (6.7%, a difference of 0.60%), and Ute (6.6%, a difference of 0.97%).
| Demographics | Rating | Rank | Male Unemployment |
| Vietnamese | 0.0 /100 | #300 | Tragic 6.6% |
| Immigrants | Belize | 0.0 /100 | #301 | Tragic 6.6% |
| Ute | 0.0 /100 | #302 | Tragic 6.6% |
| Immigrants | West Indies | 0.0 /100 | #303 | Tragic 6.7% |
| West Indians | 0.0 /100 | #304 | Tragic 6.7% |
| Trinidadians and Tobagonians | 0.0 /100 | #305 | Tragic 6.7% |
| Immigrants | Trinidad and Tobago | 0.0 /100 | #306 | Tragic 6.7% |
| Immigrants | Jamaica | 0.0 /100 | #307 | Tragic 6.7% |
| Aleuts | 0.0 /100 | #308 | Tragic 6.8% |
| Barbadians | 0.0 /100 | #309 | Tragic 6.9% |
| Blacks/African Americans | 0.0 /100 | #310 | Tragic 6.9% |
| Immigrants | Armenia | 0.0 /100 | #311 | Tragic 6.9% |
| Lumbee | 0.0 /100 | #312 | Tragic 6.9% |
| Immigrants | Dominica | 0.0 /100 | #313 | Tragic 7.0% |
| Immigrants | Barbados | 0.0 /100 | #314 | Tragic 7.1% |
Demographics Similar to Immigrants from Western Europe by Male Unemployment
In terms of male unemployment, the demographic groups most similar to Immigrants from Western Europe are Hungarian (5.2%, a difference of 0.030%), Immigrants from Malaysia (5.2%, a difference of 0.15%), Immigrants from Brazil (5.2%, a difference of 0.18%), Immigrants from Germany (5.2%, a difference of 0.20%), and Chickasaw (5.2%, a difference of 0.21%).
| Demographics | Rating | Rank | Male Unemployment |
| Nicaraguans | 88.2 /100 | #122 | Excellent 5.1% |
| Palestinians | 87.7 /100 | #123 | Excellent 5.1% |
| Immigrants | Latvia | 87.5 /100 | #124 | Excellent 5.1% |
| Immigrants | Lithuania | 87.2 /100 | #125 | Excellent 5.1% |
| Immigrants | Colombia | 86.8 /100 | #126 | Excellent 5.1% |
| Immigrants | Brazil | 86.3 /100 | #127 | Excellent 5.2% |
| Hungarians | 85.1 /100 | #128 | Excellent 5.2% |
| Immigrants | Western Europe | 84.8 /100 | #129 | Excellent 5.2% |
| Immigrants | Malaysia | 83.5 /100 | #130 | Excellent 5.2% |
| Immigrants | Germany | 83.0 /100 | #131 | Excellent 5.2% |
| Chickasaw | 82.9 /100 | #132 | Excellent 5.2% |
| Colombians | 81.1 /100 | #133 | Excellent 5.2% |
| Pakistanis | 80.5 /100 | #134 | Excellent 5.2% |
| Immigrants | Saudi Arabia | 80.1 /100 | #135 | Excellent 5.2% |
| Lebanese | 79.9 /100 | #136 | Good 5.2% |