Immigrants from Poland vs Belizean Male Unemployment
COMPARE
Immigrants from Poland
Belizean
Male Unemployment
Male Unemployment Comparison
Immigrants from Poland
Belizeans
5.3%
MALE UNEMPLOYMENT
46.0/ 100
METRIC RATING
176th/ 347
METRIC RANK
6.5%
MALE UNEMPLOYMENT
0.0/ 100
METRIC RATING
295th/ 347
METRIC RANK
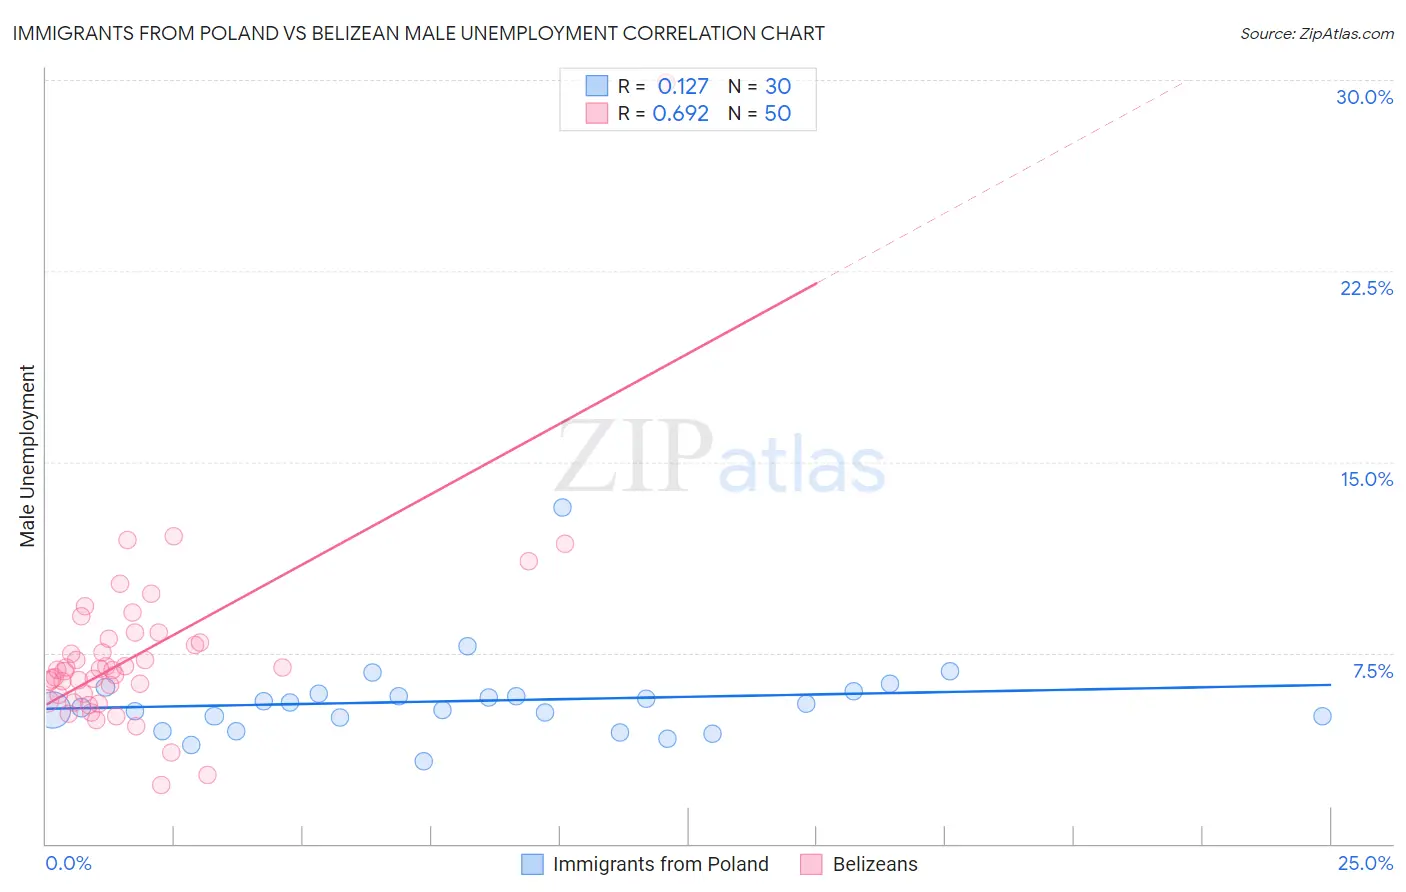
Immigrants from Poland vs Belizean Male Unemployment Correlation Chart
The statistical analysis conducted on geographies consisting of 304,027,535 people shows a poor positive correlation between the proportion of Immigrants from Poland and unemployment rate among males in the United States with a correlation coefficient (R) of 0.127 and weighted average of 5.3%. Similarly, the statistical analysis conducted on geographies consisting of 144,079,260 people shows a significant positive correlation between the proportion of Belizeans and unemployment rate among males in the United States with a correlation coefficient (R) of 0.692 and weighted average of 6.5%, a difference of 22.5%.
Male Unemployment Correlation Summary
| Measurement | Immigrants from Poland | Belizean |
| Minimum | 3.3% | 2.3% |
| Maximum | 13.2% | 29.9% |
| Range | 9.9% | 27.6% |
| Mean | 5.6% | 7.5% |
| Median | 5.4% | 6.8% |
| Interquartile 25% (IQ1) | 4.9% | 5.8% |
| Interquartile 75% (IQ3) | 5.9% | 8.1% |
| Interquartile Range (IQR) | 0.93% | 2.2% |
| Standard Deviation (Sample) | 1.7% | 3.9% |
| Standard Deviation (Population) | 1.7% | 3.8% |
Similar Demographics by Male Unemployment
Demographics Similar to Immigrants from Poland by Male Unemployment
In terms of male unemployment, the demographic groups most similar to Immigrants from Poland are Immigrants from Peru (5.3%, a difference of 0.080%), Immigrants from Iraq (5.3%, a difference of 0.12%), Osage (5.3%, a difference of 0.21%), Immigrants from Iran (5.3%, a difference of 0.23%), and Immigrants from Kazakhstan (5.3%, a difference of 0.28%).
| Demographics | Rating | Rank | Male Unemployment |
| Immigrants | Congo | 57.4 /100 | #169 | Average 5.3% |
| Immigrants | Eastern Europe | 54.1 /100 | #170 | Average 5.3% |
| Peruvians | 51.9 /100 | #171 | Average 5.3% |
| Immigrants | Kazakhstan | 50.8 /100 | #172 | Average 5.3% |
| Immigrants | Russia | 50.7 /100 | #173 | Average 5.3% |
| Immigrants | Iran | 50.0 /100 | #174 | Average 5.3% |
| Immigrants | Iraq | 48.1 /100 | #175 | Average 5.3% |
| Immigrants | Poland | 46.0 /100 | #176 | Average 5.3% |
| Immigrants | Peru | 44.6 /100 | #177 | Average 5.3% |
| Osage | 42.5 /100 | #178 | Average 5.3% |
| Immigrants | Oceania | 40.8 /100 | #179 | Average 5.3% |
| Malaysians | 39.6 /100 | #180 | Fair 5.3% |
| Immigrants | Afghanistan | 37.9 /100 | #181 | Fair 5.3% |
| Potawatomi | 37.8 /100 | #182 | Fair 5.3% |
| Taiwanese | 37.6 /100 | #183 | Fair 5.3% |
Demographics Similar to Belizeans by Male Unemployment
In terms of male unemployment, the demographic groups most similar to Belizeans are Immigrants from Haiti (6.5%, a difference of 0.45%), Chippewa (6.6%, a difference of 0.77%), Senegalese (6.4%, a difference of 0.85%), Jamaican (6.6%, a difference of 0.85%), and Haitian (6.4%, a difference of 0.96%).
| Demographics | Rating | Rank | Male Unemployment |
| Immigrants | Senegal | 0.0 /100 | #288 | Tragic 6.3% |
| Immigrants | Caribbean | 0.0 /100 | #289 | Tragic 6.3% |
| U.S. Virgin Islanders | 0.0 /100 | #290 | Tragic 6.4% |
| Immigrants | Azores | 0.0 /100 | #291 | Tragic 6.4% |
| Nepalese | 0.0 /100 | #292 | Tragic 6.4% |
| Haitians | 0.0 /100 | #293 | Tragic 6.4% |
| Senegalese | 0.0 /100 | #294 | Tragic 6.4% |
| Belizeans | 0.0 /100 | #295 | Tragic 6.5% |
| Immigrants | Haiti | 0.0 /100 | #296 | Tragic 6.5% |
| Chippewa | 0.0 /100 | #297 | Tragic 6.6% |
| Jamaicans | 0.0 /100 | #298 | Tragic 6.6% |
| Immigrants | Bangladesh | 0.0 /100 | #299 | Tragic 6.6% |
| Vietnamese | 0.0 /100 | #300 | Tragic 6.6% |
| Immigrants | Belize | 0.0 /100 | #301 | Tragic 6.6% |
| Ute | 0.0 /100 | #302 | Tragic 6.6% |