Nigerian vs Belizean Male Unemployment
COMPARE
Nigerian
Belizean
Male Unemployment
Male Unemployment Comparison
Nigerians
Belizeans
5.9%
MALE UNEMPLOYMENT
0.0/ 100
METRIC RATING
267th/ 347
METRIC RANK
6.5%
MALE UNEMPLOYMENT
0.0/ 100
METRIC RATING
295th/ 347
METRIC RANK
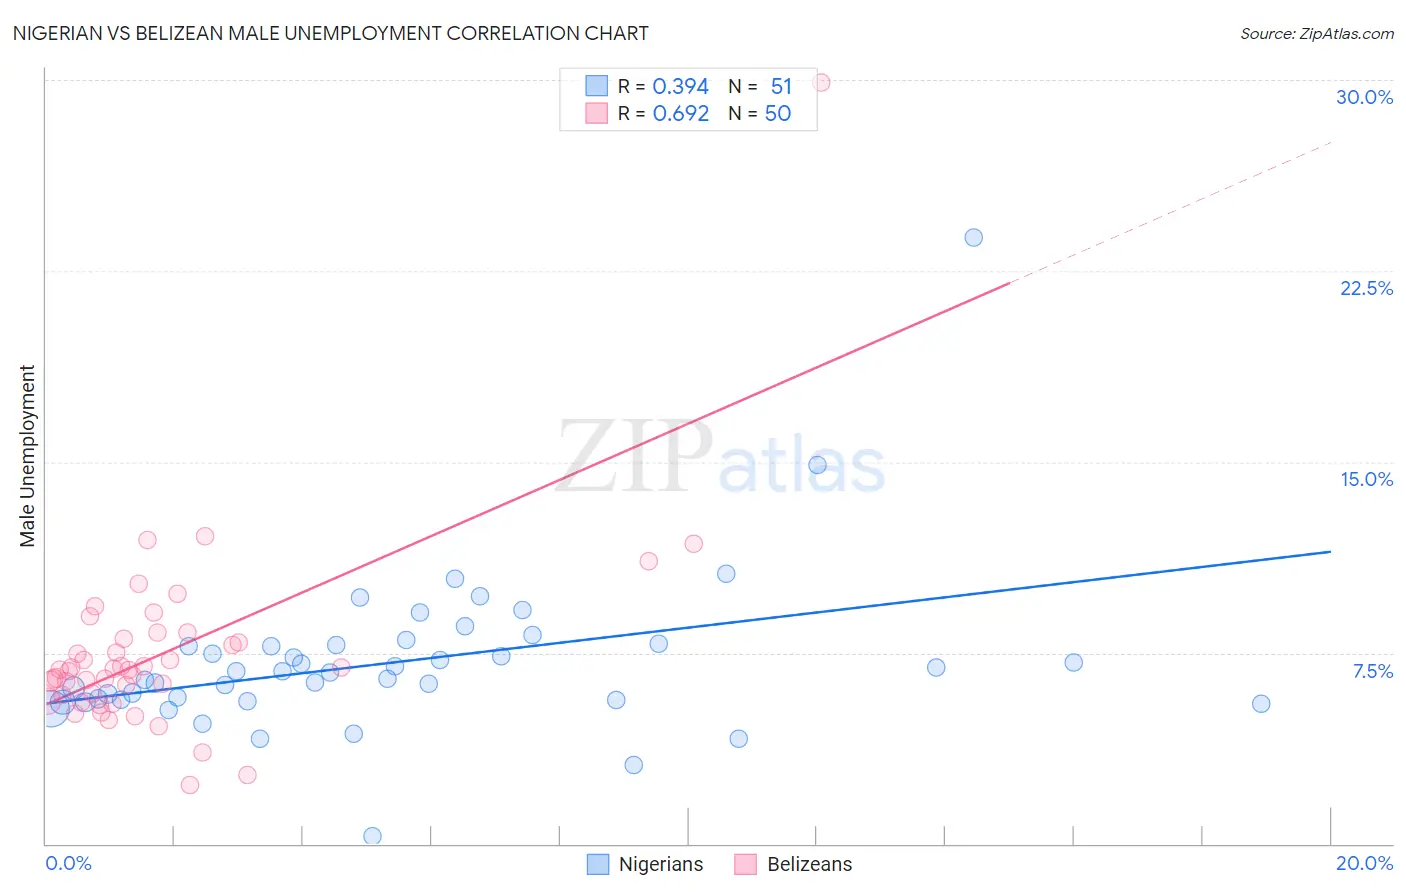
Nigerian vs Belizean Male Unemployment Correlation Chart
The statistical analysis conducted on geographies consisting of 332,030,597 people shows a mild positive correlation between the proportion of Nigerians and unemployment rate among males in the United States with a correlation coefficient (R) of 0.394 and weighted average of 5.9%. Similarly, the statistical analysis conducted on geographies consisting of 144,079,260 people shows a significant positive correlation between the proportion of Belizeans and unemployment rate among males in the United States with a correlation coefficient (R) of 0.692 and weighted average of 6.5%, a difference of 9.7%.
Male Unemployment Correlation Summary
| Measurement | Nigerian | Belizean |
| Minimum | 0.30% | 2.3% |
| Maximum | 23.8% | 29.9% |
| Range | 23.5% | 27.6% |
| Mean | 7.1% | 7.5% |
| Median | 6.7% | 6.8% |
| Interquartile 25% (IQ1) | 5.7% | 5.8% |
| Interquartile 75% (IQ3) | 7.8% | 8.1% |
| Interquartile Range (IQR) | 2.2% | 2.2% |
| Standard Deviation (Sample) | 3.2% | 3.9% |
| Standard Deviation (Population) | 3.2% | 3.8% |
Similar Demographics by Male Unemployment
Demographics Similar to Nigerians by Male Unemployment
In terms of male unemployment, the demographic groups most similar to Nigerians are Bahamian (5.9%, a difference of 0.12%), Bermudan (5.9%, a difference of 0.21%), French American Indian (5.9%, a difference of 0.26%), Immigrants from Nigeria (6.0%, a difference of 0.48%), and Subsaharan African (6.0%, a difference of 0.61%).
| Demographics | Rating | Rank | Male Unemployment |
| Immigrants | Central America | 0.1 /100 | #260 | Tragic 5.8% |
| Liberians | 0.1 /100 | #261 | Tragic 5.8% |
| Immigrants | Portugal | 0.1 /100 | #262 | Tragic 5.9% |
| Immigrants | Latin America | 0.1 /100 | #263 | Tragic 5.9% |
| Immigrants | Mexico | 0.0 /100 | #264 | Tragic 5.9% |
| French American Indians | 0.0 /100 | #265 | Tragic 5.9% |
| Bahamians | 0.0 /100 | #266 | Tragic 5.9% |
| Nigerians | 0.0 /100 | #267 | Tragic 5.9% |
| Bermudans | 0.0 /100 | #268 | Tragic 5.9% |
| Immigrants | Nigeria | 0.0 /100 | #269 | Tragic 6.0% |
| Sub-Saharan Africans | 0.0 /100 | #270 | Tragic 6.0% |
| Blackfeet | 0.0 /100 | #271 | Tragic 6.0% |
| Immigrants | Uzbekistan | 0.0 /100 | #272 | Tragic 6.0% |
| Armenians | 0.0 /100 | #273 | Tragic 6.0% |
| Immigrants | Sierra Leone | 0.0 /100 | #274 | Tragic 6.0% |
Demographics Similar to Belizeans by Male Unemployment
In terms of male unemployment, the demographic groups most similar to Belizeans are Immigrants from Haiti (6.5%, a difference of 0.45%), Chippewa (6.6%, a difference of 0.77%), Senegalese (6.4%, a difference of 0.85%), Jamaican (6.6%, a difference of 0.85%), and Haitian (6.4%, a difference of 0.96%).
| Demographics | Rating | Rank | Male Unemployment |
| Immigrants | Senegal | 0.0 /100 | #288 | Tragic 6.3% |
| Immigrants | Caribbean | 0.0 /100 | #289 | Tragic 6.3% |
| U.S. Virgin Islanders | 0.0 /100 | #290 | Tragic 6.4% |
| Immigrants | Azores | 0.0 /100 | #291 | Tragic 6.4% |
| Nepalese | 0.0 /100 | #292 | Tragic 6.4% |
| Haitians | 0.0 /100 | #293 | Tragic 6.4% |
| Senegalese | 0.0 /100 | #294 | Tragic 6.4% |
| Belizeans | 0.0 /100 | #295 | Tragic 6.5% |
| Immigrants | Haiti | 0.0 /100 | #296 | Tragic 6.5% |
| Chippewa | 0.0 /100 | #297 | Tragic 6.6% |
| Jamaicans | 0.0 /100 | #298 | Tragic 6.6% |
| Immigrants | Bangladesh | 0.0 /100 | #299 | Tragic 6.6% |
| Vietnamese | 0.0 /100 | #300 | Tragic 6.6% |
| Immigrants | Belize | 0.0 /100 | #301 | Tragic 6.6% |
| Ute | 0.0 /100 | #302 | Tragic 6.6% |