Immigrants from Asia vs Bhutanese Female Unemployment
COMPARE
Immigrants from Asia
Bhutanese
Female Unemployment
Female Unemployment Comparison
Immigrants from Asia
Bhutanese
5.2%
FEMALE UNEMPLOYMENT
64.3/ 100
METRIC RATING
163rd/ 347
METRIC RANK
4.9%
FEMALE UNEMPLOYMENT
98.7/ 100
METRIC RATING
59th/ 347
METRIC RANK
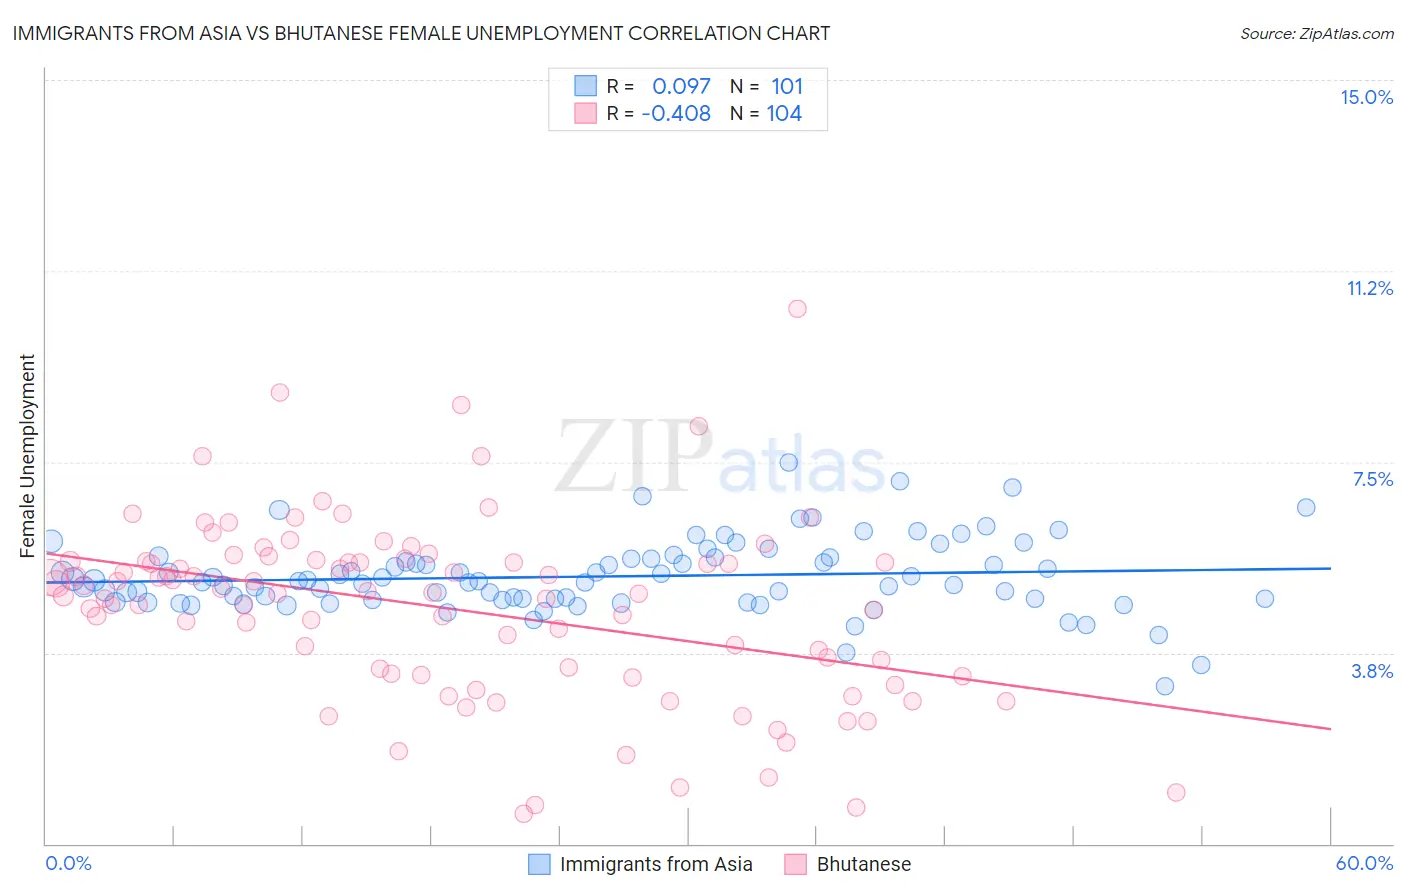
Immigrants from Asia vs Bhutanese Female Unemployment Correlation Chart
The statistical analysis conducted on geographies consisting of 540,737,875 people shows a slight positive correlation between the proportion of Immigrants from Asia and unemploymnet rate among females in the United States with a correlation coefficient (R) of 0.097 and weighted average of 5.2%. Similarly, the statistical analysis conducted on geographies consisting of 452,429,173 people shows a moderate negative correlation between the proportion of Bhutanese and unemploymnet rate among females in the United States with a correlation coefficient (R) of -0.408 and weighted average of 4.9%, a difference of 6.0%.
Female Unemployment Correlation Summary
| Measurement | Immigrants from Asia | Bhutanese |
| Minimum | 3.1% | 0.60% |
| Maximum | 7.5% | 10.5% |
| Range | 4.4% | 9.9% |
| Mean | 5.2% | 4.6% |
| Median | 5.2% | 4.9% |
| Interquartile 25% (IQ1) | 4.8% | 3.3% |
| Interquartile 75% (IQ3) | 5.6% | 5.5% |
| Interquartile Range (IQR) | 0.82% | 2.2% |
| Standard Deviation (Sample) | 0.72% | 1.8% |
| Standard Deviation (Population) | 0.72% | 1.8% |
Similar Demographics by Female Unemployment
Demographics Similar to Immigrants from Asia by Female Unemployment
In terms of female unemployment, the demographic groups most similar to Immigrants from Asia are Bangladeshi (5.2%, a difference of 0.0%), Syrian (5.2%, a difference of 0.10%), Native Hawaiian (5.2%, a difference of 0.10%), Potawatomi (5.2%, a difference of 0.11%), and Immigrants from Thailand (5.2%, a difference of 0.14%).
| Demographics | Rating | Rank | Female Unemployment |
| Immigrants | Northern Africa | 69.6 /100 | #156 | Good 5.2% |
| Immigrants | Russia | 69.3 /100 | #157 | Good 5.2% |
| Albanians | 68.3 /100 | #158 | Good 5.2% |
| Immigrants | Micronesia | 66.9 /100 | #159 | Good 5.2% |
| Immigrants | Spain | 66.8 /100 | #160 | Good 5.2% |
| Immigrants | Pakistan | 66.7 /100 | #161 | Good 5.2% |
| Potawatomi | 65.9 /100 | #162 | Good 5.2% |
| Immigrants | Asia | 64.3 /100 | #163 | Good 5.2% |
| Bangladeshis | 64.3 /100 | #164 | Good 5.2% |
| Syrians | 62.8 /100 | #165 | Good 5.2% |
| Native Hawaiians | 62.7 /100 | #166 | Good 5.2% |
| Immigrants | Thailand | 62.1 /100 | #167 | Good 5.2% |
| Sri Lankans | 59.4 /100 | #168 | Average 5.2% |
| Immigrants | Chile | 59.0 /100 | #169 | Average 5.2% |
| Spanish | 55.9 /100 | #170 | Average 5.2% |
Demographics Similar to Bhutanese by Female Unemployment
In terms of female unemployment, the demographic groups most similar to Bhutanese are Immigrants from Scotland (4.9%, a difference of 0.080%), Immigrants from Canada (4.9%, a difference of 0.090%), Immigrants from Nepal (4.9%, a difference of 0.090%), Immigrants from Lithuania (4.9%, a difference of 0.12%), and Immigrants from Belgium (4.9%, a difference of 0.20%).
| Demographics | Rating | Rank | Female Unemployment |
| Slavs | 99.1 /100 | #52 | Exceptional 4.9% |
| Whites/Caucasians | 99.0 /100 | #53 | Exceptional 4.9% |
| Immigrants | Zimbabwe | 99.0 /100 | #54 | Exceptional 4.9% |
| Immigrants | Moldova | 99.0 /100 | #55 | Exceptional 4.9% |
| Serbians | 99.0 /100 | #56 | Exceptional 4.9% |
| Icelanders | 98.8 /100 | #57 | Exceptional 4.9% |
| Immigrants | Lithuania | 98.8 /100 | #58 | Exceptional 4.9% |
| Bhutanese | 98.7 /100 | #59 | Exceptional 4.9% |
| Immigrants | Scotland | 98.6 /100 | #60 | Exceptional 4.9% |
| Immigrants | Canada | 98.6 /100 | #61 | Exceptional 4.9% |
| Immigrants | Nepal | 98.6 /100 | #62 | Exceptional 4.9% |
| Immigrants | Belgium | 98.5 /100 | #63 | Exceptional 4.9% |
| Celtics | 98.5 /100 | #64 | Exceptional 4.9% |
| Immigrants | North America | 98.3 /100 | #65 | Exceptional 4.9% |
| Hungarians | 98.3 /100 | #66 | Exceptional 4.9% |