Immigrants from Iraq vs Immigrants from Uganda Unemployment Among Women with Children Ages 6 to 17 years
COMPARE
Immigrants from Iraq
Immigrants from Uganda
Unemployment Among Women with Children Ages 6 to 17 years
Unemployment Among Women with Children Ages 6 to 17 years Comparison
Immigrants from Iraq
Immigrants from Uganda
8.1%
UNEMPLOYMENT AMONG WOMEN WITH CHILDREN AGES 6 TO 17 YEARS
100.0/ 100
METRIC RATING
52nd/ 347
METRIC RANK
10.7%
UNEMPLOYMENT AMONG WOMEN WITH CHILDREN AGES 6 TO 17 YEARS
0.0/ 100
METRIC RATING
319th/ 347
METRIC RANK
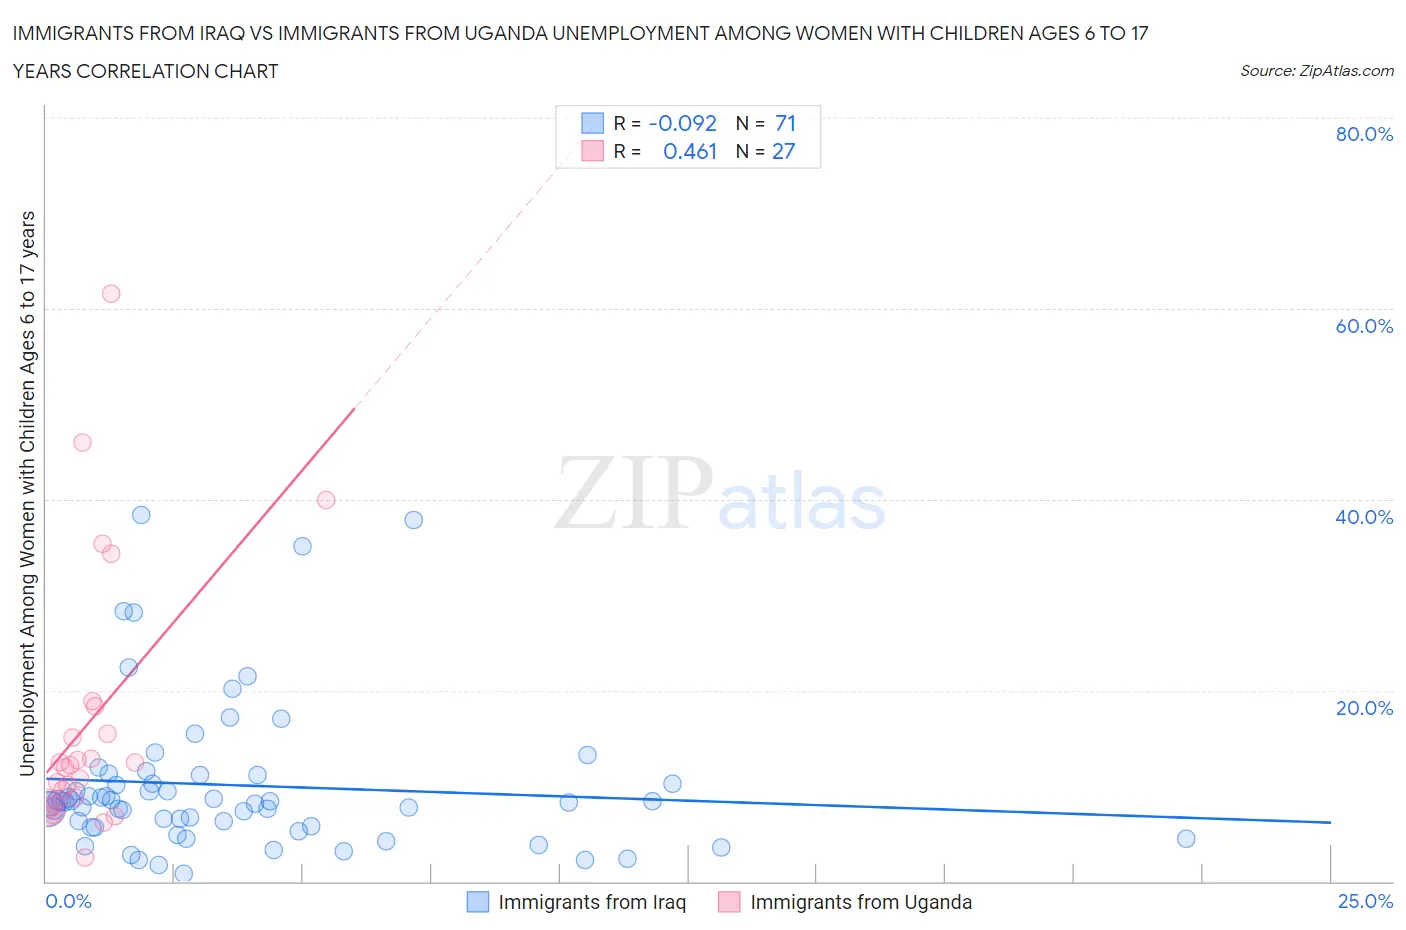
Immigrants from Iraq vs Immigrants from Uganda Unemployment Among Women with Children Ages 6 to 17 years Correlation Chart
The statistical analysis conducted on geographies consisting of 158,568,400 people shows a slight negative correlation between the proportion of Immigrants from Iraq and unemployment rate among women with children between the ages 6 and 17 in the United States with a correlation coefficient (R) of -0.092 and weighted average of 8.1%. Similarly, the statistical analysis conducted on geographies consisting of 110,485,148 people shows a moderate positive correlation between the proportion of Immigrants from Uganda and unemployment rate among women with children between the ages 6 and 17 in the United States with a correlation coefficient (R) of 0.461 and weighted average of 10.7%, a difference of 31.0%.
Unemployment Among Women with Children Ages 6 to 17 years Correlation Summary
| Measurement | Immigrants from Iraq | Immigrants from Uganda |
| Minimum | 0.80% | 2.5% |
| Maximum | 38.4% | 61.5% |
| Range | 37.6% | 59.0% |
| Mean | 10.1% | 16.9% |
| Median | 8.3% | 12.1% |
| Interquartile 25% (IQ1) | 5.7% | 8.1% |
| Interquartile 75% (IQ3) | 11.1% | 18.3% |
| Interquartile Range (IQR) | 5.4% | 10.2% |
| Standard Deviation (Sample) | 7.9% | 14.1% |
| Standard Deviation (Population) | 7.9% | 13.8% |
Similar Demographics by Unemployment Among Women with Children Ages 6 to 17 years
Demographics Similar to Immigrants from Iraq by Unemployment Among Women with Children Ages 6 to 17 years
In terms of unemployment among women with children ages 6 to 17 years, the demographic groups most similar to Immigrants from Iraq are Danish (8.1%, a difference of 0.060%), Immigrants from Armenia (8.2%, a difference of 0.29%), Immigrants from Sudan (8.1%, a difference of 0.30%), Immigrants from Japan (8.2%, a difference of 0.35%), and Immigrants from Bosnia and Herzegovina (8.2%, a difference of 0.36%).
| Demographics | Rating | Rank | Unemployment Among Women with Children Ages 6 to 17 years |
| Immigrants | Bulgaria | 100.0 /100 | #45 | Exceptional 8.1% |
| Icelanders | 100.0 /100 | #46 | Exceptional 8.1% |
| Immigrants | Switzerland | 100.0 /100 | #47 | Exceptional 8.1% |
| Immigrants | Asia | 100.0 /100 | #48 | Exceptional 8.1% |
| Immigrants | Oceania | 100.0 /100 | #49 | Exceptional 8.1% |
| Hawaiians | 100.0 /100 | #50 | Exceptional 8.1% |
| Immigrants | Sudan | 100.0 /100 | #51 | Exceptional 8.1% |
| Immigrants | Iraq | 100.0 /100 | #52 | Exceptional 8.1% |
| Danes | 100.0 /100 | #53 | Exceptional 8.1% |
| Immigrants | Armenia | 100.0 /100 | #54 | Exceptional 8.2% |
| Immigrants | Japan | 100.0 /100 | #55 | Exceptional 8.2% |
| Immigrants | Bosnia and Herzegovina | 100.0 /100 | #56 | Exceptional 8.2% |
| Immigrants | Laos | 100.0 /100 | #57 | Exceptional 8.2% |
| Immigrants | Malaysia | 100.0 /100 | #58 | Exceptional 8.2% |
| Immigrants | Philippines | 100.0 /100 | #59 | Exceptional 8.2% |
Demographics Similar to Immigrants from Uganda by Unemployment Among Women with Children Ages 6 to 17 years
In terms of unemployment among women with children ages 6 to 17 years, the demographic groups most similar to Immigrants from Uganda are Apache (10.7%, a difference of 0.020%), Tohono O'odham (10.7%, a difference of 0.19%), Delaware (10.5%, a difference of 1.3%), Bermudan (10.5%, a difference of 1.3%), and Immigrants from Dominica (10.5%, a difference of 1.4%).
| Demographics | Rating | Rank | Unemployment Among Women with Children Ages 6 to 17 years |
| Africans | 0.0 /100 | #312 | Tragic 10.4% |
| Americans | 0.0 /100 | #313 | Tragic 10.4% |
| Immigrants | Cabo Verde | 0.0 /100 | #314 | Tragic 10.4% |
| Bahamians | 0.0 /100 | #315 | Tragic 10.4% |
| Immigrants | Dominica | 0.0 /100 | #316 | Tragic 10.5% |
| Bermudans | 0.0 /100 | #317 | Tragic 10.5% |
| Delaware | 0.0 /100 | #318 | Tragic 10.5% |
| Immigrants | Uganda | 0.0 /100 | #319 | Tragic 10.7% |
| Apache | 0.0 /100 | #320 | Tragic 10.7% |
| Tohono O'odham | 0.0 /100 | #321 | Tragic 10.7% |
| Cree | 0.0 /100 | #322 | Tragic 10.8% |
| Dominicans | 0.0 /100 | #323 | Tragic 10.8% |
| Immigrants | Dominican Republic | 0.0 /100 | #324 | Tragic 10.8% |
| Cajuns | 0.0 /100 | #325 | Tragic 10.8% |
| Liberians | 0.0 /100 | #326 | Tragic 10.8% |