Immigrants from Guyana vs Yuman Unemployment
COMPARE
Immigrants from Guyana
Yuman
Unemployment
Unemployment Comparison
Immigrants from Guyana
Yuman
6.9%
UNEMPLOYMENT
0.0/ 100
METRIC RATING
321st/ 347
METRIC RANK
9.1%
UNEMPLOYMENT
0.0/ 100
METRIC RATING
343rd/ 347
METRIC RANK
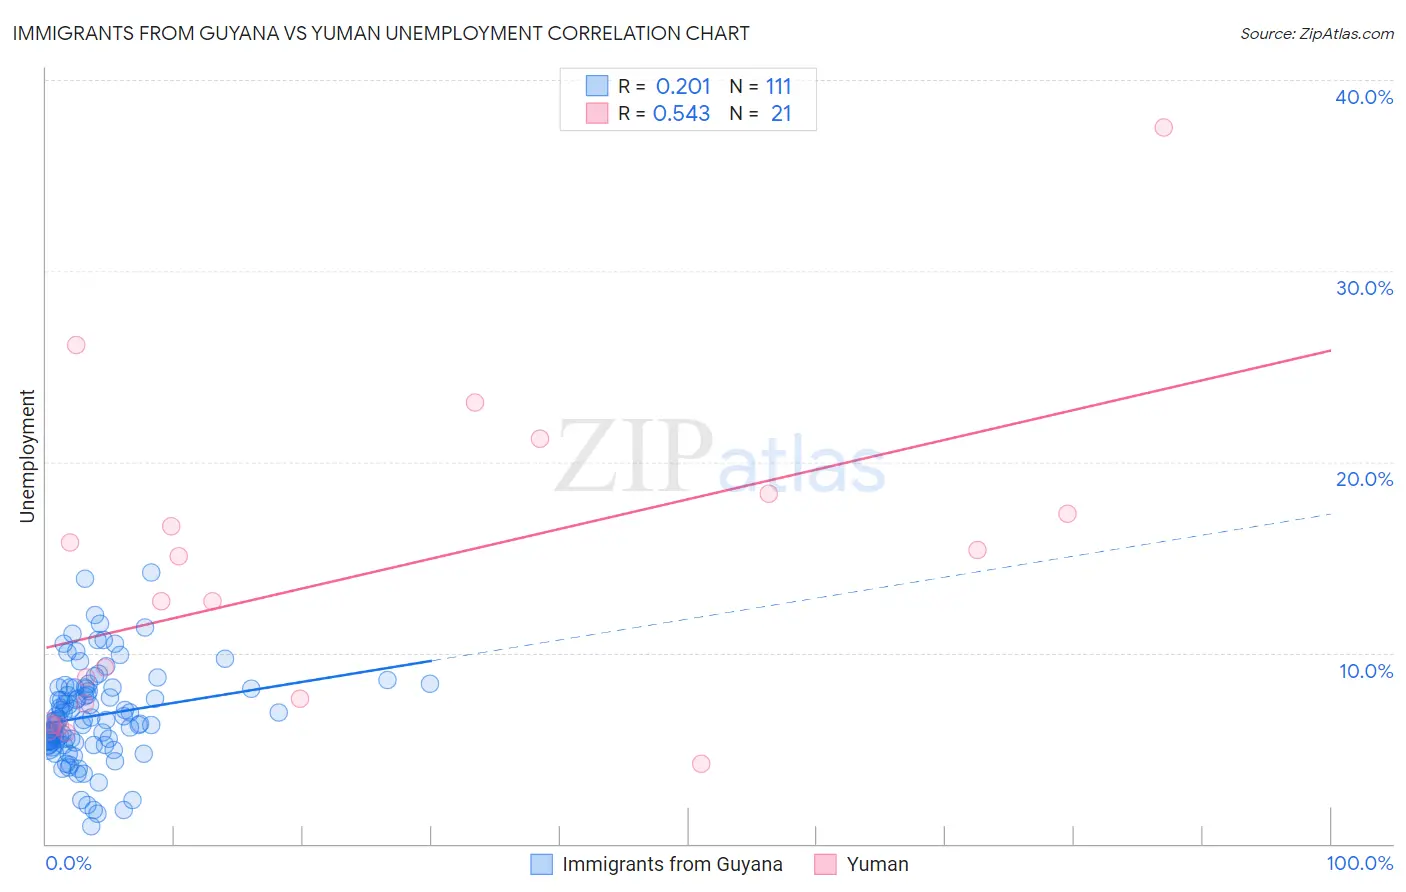
Immigrants from Guyana vs Yuman Unemployment Correlation Chart
The statistical analysis conducted on geographies consisting of 183,677,376 people shows a weak positive correlation between the proportion of Immigrants from Guyana and unemployment in the United States with a correlation coefficient (R) of 0.201 and weighted average of 6.9%. Similarly, the statistical analysis conducted on geographies consisting of 40,662,591 people shows a substantial positive correlation between the proportion of Yuman and unemployment in the United States with a correlation coefficient (R) of 0.543 and weighted average of 9.1%, a difference of 31.6%.
Unemployment Correlation Summary
| Measurement | Immigrants from Guyana | Yuman |
| Minimum | 0.90% | 4.2% |
| Maximum | 14.2% | 37.5% |
| Range | 13.3% | 33.3% |
| Mean | 6.7% | 14.0% |
| Median | 6.5% | 12.7% |
| Interquartile 25% (IQ1) | 5.3% | 6.8% |
| Interquartile 75% (IQ3) | 8.2% | 17.8% |
| Interquartile Range (IQR) | 2.9% | 11.0% |
| Standard Deviation (Sample) | 2.5% | 8.3% |
| Standard Deviation (Population) | 2.5% | 8.1% |
Similar Demographics by Unemployment
Demographics Similar to Immigrants from Guyana by Unemployment
In terms of unemployment, the demographic groups most similar to Immigrants from Guyana are Immigrants from St. Vincent and the Grenadines (6.9%, a difference of 0.010%), Guyanese (6.9%, a difference of 0.040%), Immigrants from Grenada (6.9%, a difference of 0.36%), British West Indian (6.8%, a difference of 0.81%), and Immigrants from Cabo Verde (6.8%, a difference of 1.0%).
| Demographics | Rating | Rank | Unemployment |
| Blacks/African Americans | 0.0 /100 | #314 | Tragic 6.6% |
| Houma | 0.0 /100 | #315 | Tragic 6.7% |
| Immigrants | Dominica | 0.0 /100 | #316 | Tragic 6.7% |
| Shoshone | 0.0 /100 | #317 | Tragic 6.8% |
| Immigrants | Cabo Verde | 0.0 /100 | #318 | Tragic 6.8% |
| British West Indians | 0.0 /100 | #319 | Tragic 6.8% |
| Immigrants | St. Vincent and the Grenadines | 0.0 /100 | #320 | Tragic 6.9% |
| Immigrants | Guyana | 0.0 /100 | #321 | Tragic 6.9% |
| Guyanese | 0.0 /100 | #322 | Tragic 6.9% |
| Immigrants | Grenada | 0.0 /100 | #323 | Tragic 6.9% |
| Immigrants | Armenia | 0.0 /100 | #324 | Tragic 7.0% |
| Natives/Alaskans | 0.0 /100 | #325 | Tragic 7.0% |
| Paiute | 0.0 /100 | #326 | Tragic 7.1% |
| Pueblo | 0.0 /100 | #327 | Tragic 7.2% |
| Tsimshian | 0.0 /100 | #328 | Tragic 7.2% |
Demographics Similar to Yuman by Unemployment
In terms of unemployment, the demographic groups most similar to Yuman are Hopi (8.9%, a difference of 1.7%), Tohono O'odham (8.9%, a difference of 2.1%), Puerto Rican (8.4%, a difference of 7.7%), Arapaho (9.8%, a difference of 8.4%), and Navajo (8.4%, a difference of 8.5%).
| Demographics | Rating | Rank | Unemployment |
| Immigrants | Dominican Republic | 0.0 /100 | #333 | Tragic 7.4% |
| Apache | 0.0 /100 | #334 | Tragic 7.4% |
| Alaskan Athabascans | 0.0 /100 | #335 | Tragic 7.7% |
| Immigrants | Yemen | 0.0 /100 | #336 | Tragic 7.7% |
| Cheyenne | 0.0 /100 | #337 | Tragic 8.0% |
| Pima | 0.0 /100 | #338 | Tragic 8.2% |
| Navajo | 0.0 /100 | #339 | Tragic 8.4% |
| Puerto Ricans | 0.0 /100 | #340 | Tragic 8.4% |
| Tohono O'odham | 0.0 /100 | #341 | Tragic 8.9% |
| Hopi | 0.0 /100 | #342 | Tragic 8.9% |
| Yuman | 0.0 /100 | #343 | Tragic 9.1% |
| Arapaho | 0.0 /100 | #344 | Tragic 9.8% |
| Inupiat | 0.0 /100 | #345 | Tragic 10.1% |
| Crow | 0.0 /100 | #346 | Tragic 11.1% |
| Yup'ik | 0.0 /100 | #347 | Tragic 13.6% |